IVOO etf prediction: down to 91.38 USD Vanguard S&P Mid-Cap 400 fund price price prognosis

ETF

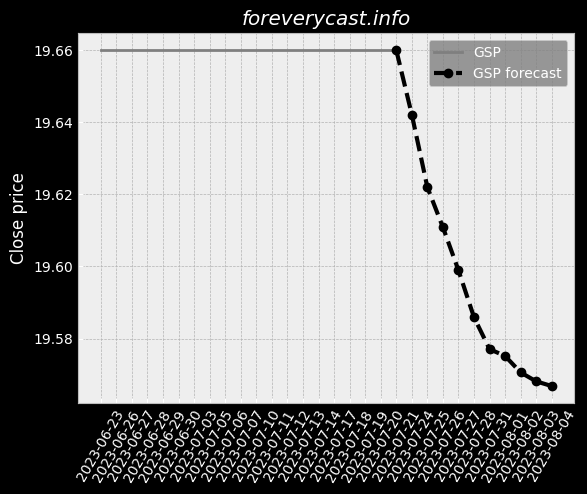
Forecast for Tue 14 Jan 2025 price 91.07

Vanguard S&P Mid-Cap 400 etf price forecast for further price development down to -9.39% (time horizon: 1 day) and price target of 91.38 USD. Short-term (time horizon: 2 weeks) Vanguard S&P Mid-Cap 400 fund price prediction for 2025-01-14 with daily closed price projections

Key Facts

Symbol IVOO 

ISIN US9219328856 

CUSIP 921932885


Currency USD

Forecast price change %

Relative Strength Index (RSI)

Finance numbers

Total Assets 3,070,932,681.51


Total Liabilities 31,900,070.73


Net Assets 3,039,032,610.78

On our site we made daily predictions for finance products based on statistical analysis. You can export / download forecasted data as CSV file, no login required. The information can be used for day trading.

Candlestick patterns

Candlestick patterns can be used as additional information for price prediction. Following list show which pattern applies on latest price information.

Institutional ownership list is based on filling form information

Holding name Date Amount
A - Atria Wealth Solutions, Inc. 2023-03-31 7859
A - OSAIC HOLDINGS, INC. 2023-06-30 109372
MEITAV INVESTMENT HOUSE LTD 2023-06-30 303394
Front Row Advisors LLC 2023-03-31 30
B. Riley Wealth Advisors, Inc. 2022-12-31 1300

Fund ownership list is based on filling form information

Fund name Date Amount Profile
EMPOWER FUNDS, INC. 2023-06-30 27413 Long
EMPOWER FUNDS, INC. 2023-03-31 28050 Long
EMPOWER FUNDS, INC. 2023-12-31 25005 Long

Portfolio Investments Report associated with Fund VANGUARD ADMIRAL FUNDS

Symbol Cusip Name Amount Value Title Of Class Pay of profile
0 302081104 ExlService Holdings Inc 215464.0 6112713.68 CORP Long
0 88023U101 Tempur Sealy International Inc 223832.0 9024906.24 CORP Long
0 100557107 Boston Beer Co Inc/The 12290.0 4360000.4 CORP Long
0 15118V207 Celsius Holdings Inc 191943.0 9503097.93 CORP Long
0 830566105 Skechers USA Inc 174699.0 10291518.09 CORP Long


Bollinger Bollinger Bands for Vanguard S&P Mid-Cap 400 can provide the information where the market is moving based on price information.


Vanguard S&P Mid-Cap 400 Short Volume Ratio is shown in the diagram. Short volume sales can be seen as an investor sentiment.


Converting prices to returns Vanguard S&P Mid-Cap 400.


On-Balance Volume information for Vanguard S&P Mid-Cap 400. On-Balance Volume information can be an indicator for bullish or bearish outcome.


Accumulation / Distribution (A/D) indicator information for Vanguard S&P Mid-Cap 400. The indicator identify divergences between price and volume flow.


Aroon Oscillator information for Vanguard S&P Mid-Cap 400. The trend-following indicator can show the strengh of a current trend and likelihood that trend can continue.


Average Directional Index (ADX) information for Vanguard S&P Mid-Cap 400. The index can be used to identify the strengh of a trend.


Moving Average Convergence Divergence (MACD) for Vanguard S&P Mid-Cap 400. The indicator helps to predict trend direction and the momentum of the trend.


Stochastic Oscillator as momentum indicator for Vanguard S&P Mid-Cap 400. The indicator is useful for identifying overbought and oversold levels.


Relative Strength Index (RSI) for Vanguard S&P Mid-Cap 400. RSI is a momentum oscillator that measures the speed and change of price development. The momentum indicator was created by analyst Welles Wilder. The result compares recent gains and losses over restricted time period. Primary usage of the indicator is to identify overbought or oversold signals. When RSI indicator reaches a value of 70 it could mean that speculators should consider selling, suggests Wilder and Chong. Or vice versa when selling excess at which the RSI Indicators show a value of 30 [ Relative Strength Index for Developing Effective Trading Strategies in Constructing Optimal Portfolio ].


Heikin Ashi trading signals are generated based on the Heikin Ashi candles, which are a type of candlestick that smooths out the price action and can help to identify trends. Heikin Ashi signals can be used to identify both long and short trading opportunities.


The awesome oscillator is a momentum indicator that measures the speed and strength of price movements. It is calculated by subtracting a 34-period simple moving average (SMA) from a 5-period SMA.


The Parabolic SAR indicator is a trend-following indicator that uses a series of dots to indicate when a trend is likely to reverse. The Parabolic SAR is a lagging indicator, meaning that it does not predict reversals, but rather confirms them after they have already occurred.


Moving Average Crossover


52W High 52W Low Market Cap

Similar shares

Vanguard S&P Mid-Cap 400 on Nasdaq

Vanguard S&P Mid-Cap 400 on finviz

Figure below show the etf predictions.
Date Closing price Prediction was updated
2024-12-06 91.38 2024-05-07 06:43
2024-12-04 91.41 2024-05-07 06:43
2024-12-05 91.39 2024-05-07 06:43
2024-12-02 91.44 2024-05-07 06:43
2024-12-18 91.27 2024-05-07 06:43
2024-12-10 91.35 2024-05-07 06:43
2024-12-16 91.30 2024-05-07 06:43
2024-12-17 91.29 2024-05-07 06:43
2024-12-12 91.32 2024-05-07 06:43
2024-12-03 91.42 2024-05-07 06:43
2024-12-11 91.34 2024-05-07 06:43
2024-12-13 91.31 2024-05-07 06:43
2024-12-09 91.37 2024-05-07 06:43
2024-12-19 91.26 2024-05-07 06:43
2024-12-23 91.24 2024-05-07 06:43
2024-12-24 91.22 2024-05-07 06:43
2024-12-20 91.25 2024-05-07 06:43
2024-08-19 93.84 2024-05-07 06:43
2024-12-25 91.21 2024-05-07 06:43
2024-12-26 91.20 2024-05-07 06:43
2025-01-02 91.15 2024-05-07 06:43
2025-01-01 91.16 2024-05-07 06:43
2024-12-27 91.19 2024-05-07 06:43
2024-12-30 91.18 2024-05-07 06:43
2024-12-31 91.17 2024-05-07 06:43
2024-05-16 99.17 2024-05-07 06:43
2024-05-30 98.74 2024-05-07 06:43
2024-07-01 96.55 2024-05-07 06:43
2024-07-03 96.35 2024-05-07 06:43
2024-07-04 96.23 2024-05-07 06:43
2024-07-12 95.71 2024-05-07 06:43
2024-07-24 95.05 2024-05-07 06:43
2024-07-25 94.98 2024-05-07 06:43
2024-07-26 94.91 2024-05-07 06:43
2024-08-07 94.34 2024-05-07 06:43
2024-08-12 94.14 2024-05-07 06:43
2024-08-22 93.68 2024-05-07 06:43
2024-09-04 93.22 2024-05-07 06:43
2024-09-19 92.75 2024-05-07 06:43
2024-09-20 92.72 2024-05-07 06:43
2024-09-24 92.64 2024-05-07 06:43
2024-10-02 92.43 2024-05-07 06:43
2024-10-03 92.40 2024-05-07 06:43
2024-10-04 92.37 2024-05-07 06:43
2024-10-07 92.34 2024-05-07 06:43
2024-10-10 92.25 2024-05-07 06:43
2024-10-11 92.22 2024-05-07 06:43
2024-10-14 92.19 2024-05-07 06:43
2024-10-15 92.16 2024-05-07 06:43
2024-11-18 91.61 2024-05-07 06:43
2024-11-21 91.55 2024-05-07 06:43
2024-11-22 91.54 2024-05-07 06:43
2024-11-26 91.50 2024-05-07 06:43
2025-01-06 91.13 2024-05-07 06:43
2025-01-07 91.12 2024-05-07 06:43
2025-01-08 91.11 2024-05-07 06:43
2025-01-03 91.14 2024-05-07 06:43
2025-01-13 91.08 2024-05-07 06:43
2025-01-14 91.07 2024-05-07 06:43
2025-01-10 91.09 2024-05-07 06:43
2025-01-09 91.10 2024-05-07 06:43
2024-08-16 93.90 2024-05-07 06:43
2024-09-02 93.32 2024-05-07 06:43
2024-09-10 93.04 2024-05-07 06:43
2024-09-23 92.68 2024-05-07 06:43
2024-11-27 91.49 2024-05-07 06:43
2024-10-08 92.31 2024-05-07 06:43
2024-10-09 92.28 2024-05-07 06:43
2024-11-19 91.59 2024-05-07 06:43
2024-11-20 91.57 2024-05-07 06:43
2024-11-25 91.52 2024-05-07 06:43
2024-11-28 91.47 2024-05-07 06:43
2024-05-23 99.19 2024-05-07 06:43
2024-05-27 98.88 2024-05-07 06:43
2024-06-04 98.52 2024-05-07 06:43
2024-06-25 96.94 2024-05-07 06:43
2024-06-26 96.88 2024-05-07 06:43
2024-07-02 96.47 2024-05-07 06:43
2024-07-05 96.14 2024-05-07 06:43
2024-07-08 96.08 2024-05-07 06:43
2024-07-09 96.00 2024-05-07 06:43
2024-07-10 95.89 2024-05-07 06:43
2024-07-11 95.79 2024-05-07 06:43
2024-07-16 95.54 2024-05-07 06:43
2024-07-17 95.44 2024-05-07 06:43
2024-08-14 94.02 2024-05-07 06:43
2024-08-20 93.79 2024-05-07 06:43
2024-08-21 93.73 2024-05-07 06:43
2024-08-26 93.57 2024-05-07 06:43
2024-08-27 93.52 2024-05-07 06:43
2024-08-28 93.47 2024-05-07 06:43
2024-08-29 93.42 2024-05-07 06:43
2024-08-30 93.36 2024-05-07 06:43
2024-09-03 93.27 2024-05-07 06:43
2024-05-09 99.94 2024-05-07 06:43
2024-05-10 99.75 2024-05-07 06:43
2024-05-14 99.34 2024-05-07 06:43
2024-05-15 99.09 2024-05-07 06:43
2024-05-17 99.49 2024-05-07 06:43
2024-05-20 99.60 2024-05-07 06:43
2024-05-21 99.37 2024-05-07 06:43
2024-05-22 99.16 2024-05-07 06:43
2024-05-24 99.27 2024-05-07 06:43
2024-05-28 98.65 2024-05-07 06:43
2024-05-29 98.66 2024-05-07 06:43
2024-05-31 98.88 2024-05-07 06:43
2024-06-03 98.71 2024-05-07 06:43
2024-06-28 96.63 2024-05-07 06:43
2024-07-22 95.22 2024-05-07 06:43
2024-07-29 94.83 2024-05-07 06:43
2024-07-30 94.75 2024-05-07 06:43
2024-07-31 94.67 2024-05-07 06:43
2024-08-01 94.61 2024-05-07 06:43
2024-08-02 94.55 2024-05-07 06:43
2024-09-11 93.00 2024-05-07 06:43
2024-09-12 92.95 2024-05-07 06:43
2024-09-13 92.91 2024-05-07 06:43
2024-09-16 92.87 2024-05-07 06:43
2024-09-17 92.83 2024-05-07 06:43
2024-09-18 92.79 2024-05-07 06:43
2024-10-16 92.13 2024-05-07 06:43
2024-10-17 92.10 2024-05-07 06:43
2024-10-18 92.08 2024-05-07 06:43
2024-10-21 92.05 2024-05-07 06:43
2024-10-22 92.02 2024-05-07 06:43
2024-10-23 92.00 2024-05-07 06:43
2024-10-24 91.97 2024-05-07 06:43
2024-10-25 91.95 2024-05-07 06:43
2024-10-28 91.92 2024-05-07 06:43
2024-10-29 91.90 2024-05-07 06:43
2024-10-30 91.88 2024-05-07 06:43
2024-10-31 91.85 2024-05-07 06:43
2024-11-01 91.83 2024-05-07 06:43
2024-11-04 91.81 2024-05-07 06:43
2024-11-05 91.79 2024-05-07 06:43
2024-11-06 91.77 2024-05-07 06:43
2024-11-07 91.75 2024-05-07 06:43
2024-11-08 91.72 2024-05-07 06:43
2024-11-11 91.70 2024-05-07 06:43
2024-11-12 91.68 2024-05-07 06:43
2024-11-13 91.67 2024-05-07 06:43
2024-11-14 91.65 2024-05-07 06:43
2024-11-15 91.63 2024-05-07 06:43
2024-05-13 99.60 2024-05-07 06:43
2024-06-27 96.75 2024-05-07 06:43
2024-08-23 93.62 2024-05-07 06:43
2024-09-05 93.17 2024-05-07 06:43
2024-09-06 93.13 2024-05-07 06:43
2024-09-09 93.09 2024-05-07 06:43
2024-07-15 95.64 2024-05-07 06:43
2024-08-05 94.47 2024-05-07 06:43
2024-08-06 94.40 2024-05-07 06:43
2024-08-08 94.28 2024-05-07 06:43
2024-08-09 94.21 2024-05-07 06:43
2024-08-13 94.08 2024-05-07 06:43
2024-08-15 93.97 2024-05-07 06:43
2024-11-29 91.46 2024-05-07 06:43
2024-09-25 92.60 2024-05-07 06:43
2024-09-26 92.57 2024-05-07 06:43
2024-09-27 92.53 2024-05-07 06:43
2024-09-30 92.50 2024-05-07 06:43
2024-10-01 92.47 2024-05-07 06:43
2024-06-05 98.43 2024-05-07 06:43
2024-06-06 98.34 2024-05-07 06:43
2024-06-07 98.17 2024-05-07 06:43
2024-06-10 97.97 2024-05-07 06:43
2024-06-11 97.89 2024-05-07 06:43
2024-06-12 97.90 2024-05-07 06:43
2024-06-13 97.84 2024-05-07 06:43
2024-06-14 97.68 2024-05-07 06:43
2024-06-17 97.53 2024-05-07 06:43
2024-06-18 97.45 2024-05-07 06:43
2024-06-19 97.40 2024-05-07 06:43
2024-06-20 97.25 2024-05-07 06:43
2024-06-21 97.09 2024-05-07 06:43
2024-06-24 97.00 2024-05-07 06:43
2024-07-18 95.36 2024-05-07 06:43
2024-07-19 95.29 2024-05-07 06:43
2024-07-23 95.13 2024-05-07 06:43

The forecast (dashed curve) of the share price performance is based on historical data. Our forecast model is based on mathematical, statistical methods. The website offers price forecasts and analysis tools for equities and other securities, which are exclusively based on the prices of these securities in the past. Information about these prices is provided to us by third parties. Although we believe, If we believe that our sources are reliable, we cannot guarantee the accuracy, completeness, timeliness and correct sequencing of this information. We do not investigate the issuers of the securities to which our forecasts relate, nor do we consider any financial data or other data of such issuers with the exception of the past prices of the securities. Therefore, our forecasts do not constitute an analysis of other commercial or financial factors or circumstances, that may be relevant for future security price flows. Investments require additional considerations. Our forecasts cannot reflect the specific situation. Experience and risk profile of an individual investor or the tax implications an investment may have for the investor. Although we believe that our mathematical models are a tool to try to explore the possibility for future price development with the help of past performance, such developments are subject to a multitude of different influences. and therefore not really predictable. We cannot guarantee the success of any investment you make based on the information published here. This website is for information purposes only. All information and data on this website cannot be guaranteed to be accurate, accuracy, completeness and appropriateness - neither explicit nor implicit.