Hanesbrands Inc stock forecast: down to 4.99 USD HBI stock price prognosis

STOCK

Forecast for Thu 18 May 2023 price 5.00

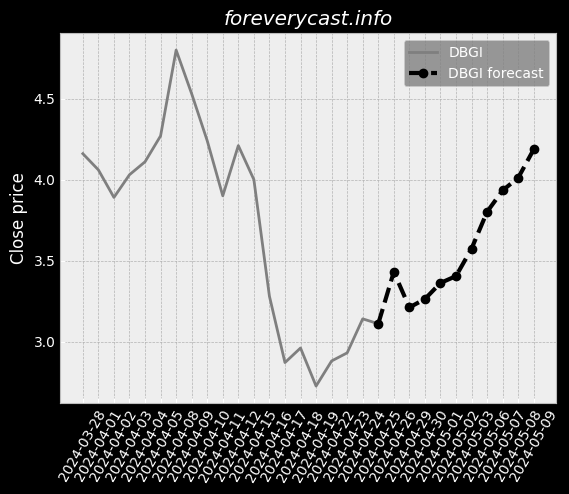
Hanesbrands Inc stock price forecast for further price development down to -3.65% (time horizon: 1 day) and price target of 4.99 USD. Positive news sentiment. Short-term (time horizon: 2 weeks) Hanesbrands Inc share price prediction for 2023-05-18 with daily closed price projections

Key Facts

Symbol HBI 

ISIN US4103451021 

CUSIP 410345102


Currency USD


Category Retail-Apparel & Accessory Stores

Forecast price change %


News sentiment (0.90)


News <--> Close correlation for next day influence (-0.22)

Finance numbers

Revenue 6,968,000,000.0


Earnings per share -0.94


Dividends 0.60

On our site we made daily predictions for finance products based on statistical analysis. You can export / download forecasted data as CSV file, no login required. The information can be used for day trading.

Summerized Form 10-K with GPT-2

We operate in the global innerwear and global activewear apparel categories. 1Table of ContentsOur fiscal year ends on the Saturday closest to December 31. During 2020, sales of PPE are included in our Innerwear and International segments. We also license our Champion name for footwear and sports accessories. Our trademarks are important to our marketing efforts and have substantial value. We also own a number of copyrights. We believe our relationships with our employees are good. As a result, our financial results could be materially adversely impacted. As a result, our business is subject to risks associated with international operations. Our balance sheet includes a significant amount of deferred tax assets. The success of our business is tied to the strength and reputation of our brands.

Summerized Form 10-K with GPT-2 https://www.sec.gov/Archives/edgar/data/1359841/000135984121000085/0001359841-21-000085.txt
Candlestick patterns

Candlestick patterns can be used as additional information for price prediction. Following list show which pattern applies on latest price information.

  • Meta analyst score 82.46/100
    • Not in ideal financial position.
    • Historical view, profit is growing.
    • Company revenue is growing faster compared with the industry.
    • Stock price is under book price value.

Institutional ownership list is based on filling form information

Holding name Date Amount
American Portfolios Advisors 2022-06-30 39855
American Portfolios Advisors 2021-12-31 36291
American Portfolios Advisors 2022-03-31 40427
American Portfolios Advisors 2022-09-30 41877
NORTH STAR ASSET MANAGEMENT INC 2022-12-31 13255

Fund ownership list is based on filling form information

Fund name Date Amount Profile
iShares Trust 2022-12-30 10776012 Long
Master Investment Portfolio 2022-12-31 203491 Long
Nationwide Variable Insurance Trust 2022-12-31 178759 Long
T. ROWE PRICE INDEX TRUST, INC. 2022-12-31 9522 Long
T. ROWE PRICE INDEX TRUST, INC. 2022-12-31 37199 Long


Bollinger Bollinger Bands for Hanesbrands Inc can provide the information where the market is moving based on price information.


Hanesbrands Inc Short Volume Ratio is shown in the diagram. Short volume sales can be seen as an investor sentiment.


Converting prices to returns Hanesbrands Inc.


On-Balance Volume information for Hanesbrands Inc. On-Balance Volume information can be an indicator for bullish or bearish outcome.


Accumulation / Distribution (A/D) indicator information for Hanesbrands Inc. The indicator identify divergences between price and volume flow.


Aroon Oscillator information for Hanesbrands Inc. The trend-following indicator can show the strengh of a current trend and likelihood that trend can continue.


Average Directional Index (ADX) information for Hanesbrands Inc. The index can be used to identify the strengh of a trend.


Moving Average Convergence Divergence (MACD) for Hanesbrands Inc. The indicator helps to predict trend direction and the momentum of the trend.


Stochastic Oscillator as momentum indicator for Hanesbrands Inc. The indicator is useful for identifying overbought and oversold levels.


Relative Strength Index (RSI) for Hanesbrands Inc. RSI is a momentum oscillator that measures the speed and change of price development. The momentum indicator was created by analyst Welles Wilder. The result compares recent gains and losses over restricted time period. Primary usage of the indicator is to identify overbought or oversold signals. When RSI indicator reaches a value of 70 it could mean that speculators should consider selling, suggests Wilder and Chong. Or vice versa when selling excess at which the RSI Indicators show a value of 30 [ Relative Strength Index for Developing Effective Trading Strategies in Constructing Optimal Portfolio ].


52W High 52W Low Market Cap

Similar shares


Hanesbrands Inc on Nasdaq

Hanesbrands Inc on finviz

Figure below show the stock predictions.
Date Closing price Prediction was updated
2023-04-27 4.99 2023-03-23 02:50
2023-04-28 5.00 2023-03-23 02:50
2023-05-01 4.99 2023-03-23 02:50
2023-05-02 4.99 2023-03-23 02:50
2023-05-08 5.00 2023-03-23 02:50
2023-05-09 5.00 2023-03-23 02:50
2023-05-10 5.00 2023-03-23 02:50
2023-05-03 5.00 2023-03-23 02:50
2023-05-04 5.00 2023-03-23 02:50
2023-05-05 5.00 2023-03-23 02:50
2023-05-11 5.00 2023-03-23 02:50
2023-05-12 5.00 2023-03-23 02:50
2023-05-15 5.00 2023-03-23 02:50
2023-05-16 5.00 2023-03-23 02:50
2023-05-17 5.00 2023-03-23 02:50
2023-05-18 5.00 2023-03-23 02:50
2023-03-24 4.94 2023-03-23 02:50
2023-03-27 4.96 2023-03-23 02:50
2023-03-28 4.96 2023-03-23 02:50
2023-03-30 4.97 2023-03-23 02:50
2023-03-31 4.95 2023-03-23 02:50
2023-04-03 4.95 2023-03-23 02:50
2023-04-04 4.97 2023-03-23 02:50
2023-04-07 4.98 2023-03-23 02:50
2023-03-29 4.97 2023-03-23 02:50
2023-04-05 4.98 2023-03-23 02:50
2023-04-06 4.96 2023-03-23 02:50
2023-04-10 4.99 2023-03-23 02:50
2023-04-11 4.98 2023-03-23 02:50
2023-04-12 4.98 2023-03-23 02:50
2023-04-13 4.97 2023-03-23 02:50
2023-04-14 4.98 2023-03-23 02:50
2023-04-17 4.99 2023-03-23 02:50
2023-04-18 4.98 2023-03-23 02:50
2023-04-19 4.99 2023-03-23 02:50
2023-04-20 4.99 2023-03-23 02:50
2023-04-21 4.99 2023-03-23 02:50
2023-04-24 4.99 2023-03-23 02:50
2023-04-25 4.99 2023-03-23 02:50
2023-04-26 4.99 2023-03-23 02:50

The forecast (dashed curve) of the share price performance is based on historical data. Our forecast model is based on mathematical, statistical methods. The website offers price forecasts and analysis tools for equities and other securities, which are exclusively based on the prices of these securities in the past. Information about these prices is provided to us by third parties. Although we believe, If we believe that our sources are reliable, we cannot guarantee the accuracy, completeness, timeliness and correct sequencing of this information. We do not investigate the issuers of the securities to which our forecasts relate, nor do we consider any financial data or other data of such issuers with the exception of the past prices of the securities. Therefore, our forecasts do not constitute an analysis of other commercial or financial factors or circumstances, that may be relevant for future security price flows. Investments require additional considerations. Our forecasts cannot reflect the specific situation. Experience and risk profile of an individual investor or the tax implications an investment may have for the investor. Although we believe that our mathematical models are a tool to try to explore the possibility for future price development with the help of past performance, such developments are subject to a multitude of different influences. and therefore not really predictable. We cannot guarantee the success of any investment you make based on the information published here. This website is for information purposes only. All information and data on this website cannot be guaranteed to be accurate, accuracy, completeness and appropriateness - neither explicit nor implicit.