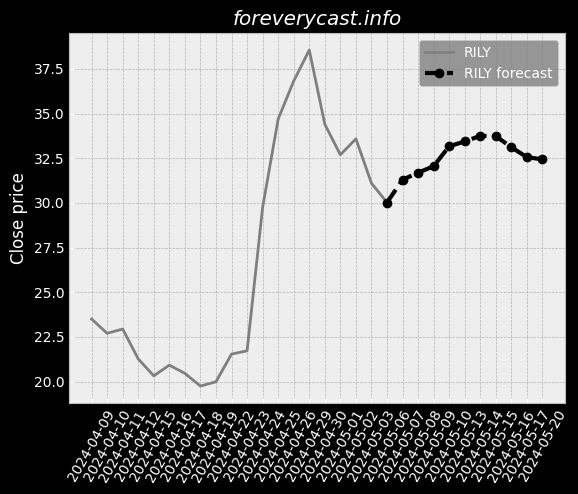
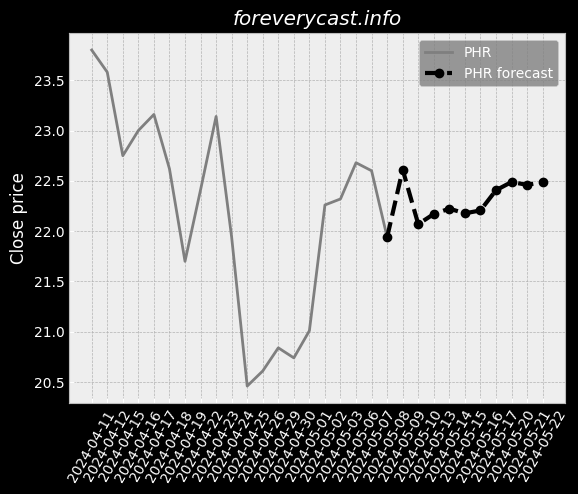
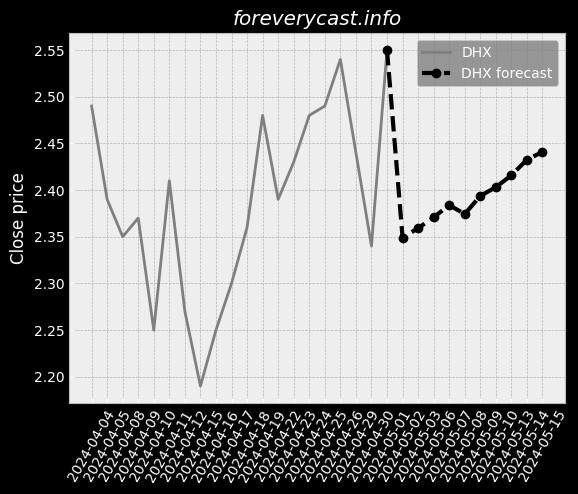
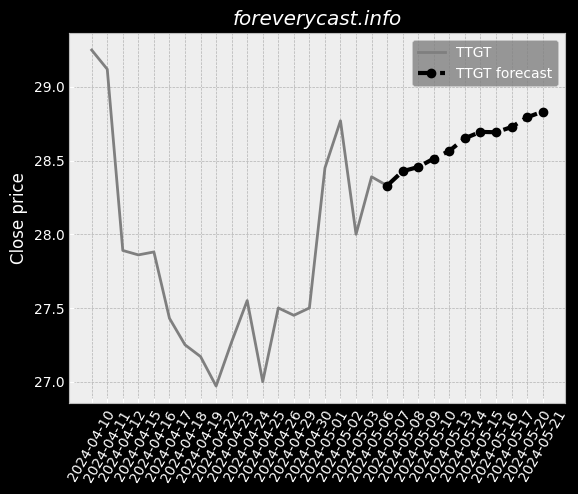
Shift4 Payments, Inc stock forecast: down to 59.47 USD FOUR stock price prognosis

STOCK

Forecast for Fri 28 Jun 2024 price 60.51

Shift4 Payments, Inc stock price forecast for further price development down to -14.03% (time horizon: 1 day) and price target of 59.47 USD. Short-term (time horizon: 2 weeks) Shift4 Payments, Inc share price prediction for 2024-06-28 with daily closed price projections

Key Facts

Symbol FOUR 

ISIN US82452J1097 

CUSIP 82452J109


Currency USD


Category Services-Business Services, Nec

Forecast price change %

Relative Strength Index (RSI)

Finance numbers

Revenue 806,800,000.0


Earnings per share -2.10


On our site we made daily predictions for finance products based on statistical analysis. You can export / download forecasted data as CSV file, no login required. The information can be used for day trading.

Summerized Form 10-K with GPT-2

Facilitating these integrations is both costly and time-consuming for software partners. We have a partner-centric distribution approach. Our businesses in those jurisdictions are subject to those data retention obligations. We believe that we have good relationships with our employees. In 2020, we built an in-house talent and recruitment department. The address of the SEC\'s website is www.sec.gov. & He holds a Bachelor of Science in Marketing and Sales from Monmouth University. Additionally, the California Privacy Rights Act, or CPRA, recently passed in California. We cannot predict the level of attrition in the future and it could increase. Such fees may result in decreased use of credit or debit cards by cardholders. If these developments were to occur, we could face increased competition. These actions may be taken even if other stockholders oppose them. As a result, the market price of our Class A common stock could be adversely affected. ITEM 1B. UNRESOLVED STAFF COMMENTS None.

Summerized Form 10-K with GPT-2 https://www.sec.gov/Archives/edgar/data/1794669/000156459021011368/0001564590-21-011368.txt
Candlestick patterns

Candlestick patterns can be used as additional information for price prediction. Following list show which pattern applies on latest price information.

  • Meta analyst score 43.40/100
    • Not in ideal financial position.
    • Historical view, profit is growing.
    • Company revenue is not growing faster compared with the industry.
    • Stock price is above book price value.

Institutional ownership list is based on filling form information

Holding name Date Amount
A - BARCLAYS PLC 2023-06-30 34890
A - OVERSEA-CHINESE BANKING Corp Ltd 2022-12-31 6826
A - OSAIC HOLDINGS, INC. 2023-06-30 93345
Ratan Capital Management LP 2023-06-30 20975
Migdal Insurance & Financial Holdings Ltd. 2023-06-30 11

Fund ownership list is based on filling form information

Fund name Date Amount Profile
Prudential Jennison Mid-Cap Growth Fund, Inc. 2023-11-30 738812 Long
Prudential Jennison Blend Fund, Inc. 2023-11-30 46796 Long
iShares Trust 2023-11-30 12798 Long
SCHWAB STRATEGIC TRUST 2023-11-30 256179 Long
SCHWAB STRATEGIC TRUST 2023-11-30 30765 Long

Insider trading for Shift4 Payments, Inc

CIK Name Date Action T-Test 1day T-Test 7day T-Test 14day T-Test 30day
1805630 Lauber David Taylor 2024-03-05 SALE Accept Accept Accept Accept
1811990 Goldsmith-grover Sarah 2023-11-28 SALE Accept Accept Accept Accept
1621493 Disman Nancy 2024-02-05 SALE Accept Accept Accept Accept
1805622 Frankel Jordan 2023-11-13 SALE Accept Accept Accept Accept


Bollinger Bollinger Bands for Shift4 Payments, Inc can provide the information where the market is moving based on price information.


Shift4 Payments, Inc Short Volume Ratio is shown in the diagram. Short volume sales can be seen as an investor sentiment.


Converting prices to returns Shift4 Payments, Inc.


On-Balance Volume information for Shift4 Payments, Inc. On-Balance Volume information can be an indicator for bullish or bearish outcome.


Accumulation / Distribution (A/D) indicator information for Shift4 Payments, Inc. The indicator identify divergences between price and volume flow.


Aroon Oscillator information for Shift4 Payments, Inc. The trend-following indicator can show the strengh of a current trend and likelihood that trend can continue.


Average Directional Index (ADX) information for Shift4 Payments, Inc. The index can be used to identify the strengh of a trend.


Moving Average Convergence Divergence (MACD) for Shift4 Payments, Inc. The indicator helps to predict trend direction and the momentum of the trend.


Stochastic Oscillator as momentum indicator for Shift4 Payments, Inc. The indicator is useful for identifying overbought and oversold levels.


Relative Strength Index (RSI) for Shift4 Payments, Inc. RSI is a momentum oscillator that measures the speed and change of price development. The momentum indicator was created by analyst Welles Wilder. The result compares recent gains and losses over restricted time period. Primary usage of the indicator is to identify overbought or oversold signals. When RSI indicator reaches a value of 70 it could mean that speculators should consider selling, suggests Wilder and Chong. Or vice versa when selling excess at which the RSI Indicators show a value of 30 [ Relative Strength Index for Developing Effective Trading Strategies in Constructing Optimal Portfolio ].


Heikin Ashi trading signals are generated based on the Heikin Ashi candles, which are a type of candlestick that smooths out the price action and can help to identify trends. Heikin Ashi signals can be used to identify both long and short trading opportunities.


The awesome oscillator is a momentum indicator that measures the speed and strength of price movements. It is calculated by subtracting a 34-period simple moving average (SMA) from a 5-period SMA.


The Parabolic SAR indicator is a trend-following indicator that uses a series of dots to indicate when a trend is likely to reverse. The Parabolic SAR is a lagging indicator, meaning that it does not predict reversals, but rather confirms them after they have already occurred.


Moving Average Crossover


52W High 52W Low Market Cap

Similar shares


Shift4 Payments, Inc on Nasdaq

Shift4 Payments, Inc on finviz

Figure below show the stock predictions.
Date Closing price Prediction was updated
2024-05-20 59.47 2024-05-04 04:50
2024-05-21 59.29 2024-05-04 04:50
2024-05-23 59.56 2024-05-04 04:50
2024-05-24 59.40 2024-05-04 04:50
2024-05-22 59.34 2024-05-04 04:50
2024-05-27 59.44 2024-05-04 04:50
2024-05-28 59.49 2024-05-04 04:50
2024-05-30 59.72 2024-05-04 04:50
2024-05-31 59.81 2024-05-04 04:50
2024-06-06 59.97 2024-05-04 04:50
2024-06-05 59.93 2024-05-04 04:50
2024-05-29 59.65 2024-05-04 04:50
2024-06-03 59.85 2024-05-04 04:50
2024-06-04 59.86 2024-05-04 04:50
2024-06-10 59.99 2024-05-04 04:50
2024-06-11 60.05 2024-05-04 04:50
2024-06-07 60.00 2024-05-04 04:50
2024-06-12 60.10 2024-05-04 04:50
2024-06-13 60.10 2024-05-04 04:50
2024-06-14 60.11 2024-05-04 04:50
2024-06-19 60.23 2024-05-04 04:50
2024-06-20 60.27 2024-05-04 04:50
2024-06-17 60.14 2024-05-04 04:50
2024-06-18 60.21 2024-05-04 04:50
2024-06-21 60.31 2024-05-04 04:50
2024-06-24 60.36 2024-05-04 04:50
2024-06-25 60.40 2024-05-04 04:50
2024-06-26 60.44 2024-05-04 04:50
2024-06-27 60.48 2024-05-04 04:50
2024-06-28 60.51 2024-05-04 04:50
2024-05-15 59.35 2024-05-04 04:50
2024-05-16 59.54 2024-05-04 04:50
2024-05-17 59.61 2024-05-04 04:50
2024-05-09 59.35 2024-05-04 04:50
2024-05-06 59.42 2024-05-04 04:50
2024-05-07 59.63 2024-05-04 04:50
2024-05-08 59.53 2024-05-04 04:50
2024-05-10 59.46 2024-05-04 04:50
2024-05-13 59.57 2024-05-04 04:50
2024-05-14 59.59 2024-05-04 04:50

The forecast (dashed curve) of the share price performance is based on historical data. Our forecast model is based on mathematical, statistical methods. The website offers price forecasts and analysis tools for equities and other securities, which are exclusively based on the prices of these securities in the past. Information about these prices is provided to us by third parties. Although we believe, If we believe that our sources are reliable, we cannot guarantee the accuracy, completeness, timeliness and correct sequencing of this information. We do not investigate the issuers of the securities to which our forecasts relate, nor do we consider any financial data or other data of such issuers with the exception of the past prices of the securities. Therefore, our forecasts do not constitute an analysis of other commercial or financial factors or circumstances, that may be relevant for future security price flows. Investments require additional considerations. Our forecasts cannot reflect the specific situation. Experience and risk profile of an individual investor or the tax implications an investment may have for the investor. Although we believe that our mathematical models are a tool to try to explore the possibility for future price development with the help of past performance, such developments are subject to a multitude of different influences. and therefore not really predictable. We cannot guarantee the success of any investment you make based on the information published here. This website is for information purposes only. All information and data on this website cannot be guaranteed to be accurate, accuracy, completeness and appropriateness - neither explicit nor implicit.