GENOCEA BIOSCIENCES INC stock forecast: down to 0.00 USD GNCA stock price prognosis

STOCK

Forecast for Fri 26 Apr 2024 price

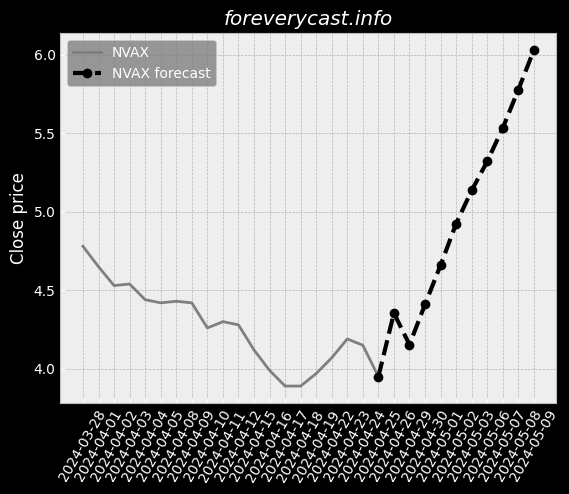
GENOCEA BIOSCIENCES INC stock price forecast for further price development down to 0.00% (time horizon: 1 day) and price target of 0.00 USD. Negative news sentiment. Short-term (time horizon: 2 weeks) GENOCEA BIOSCIENCES INC share price prediction for 2024-04-26 with daily closed price projections

Key Facts

Symbol GNCA 

ISIN US3724274010 

CUSIP 372427401


Currency USD


Category Biological Products (No Diagnostic Substances)

Forecast price change %


News sentiment (-0.05)


News <--> Close correlation for next day influence ()

Relative Strength Index (RSI)

Finance numbers

Revenue 1,359,000.0


Earnings per share -1.11


On our site we made daily predictions for finance products based on statistical analysis. You can export / download forecasted data as CSV file, no login required. The information can be used for day trading.

Summerized Form 10-K with GPT-2

We believe ATLAS could have beneficial uses beyond cancer. GEN-011 differs from TIL therapy in two critical ways. Clinical testing of biological products is subject to FDA review before initiation. In this event, the BLA must be resubmitted with the additional information. There is therefore a possibility that our practices might be challenged under such laws. Our office-based employees have been working from home since mid-March 2020. Diantha Duvall, age 49, has served as our Chief Financial Officer since March 2019. As of December 31, 2020, we had an accumulated deficit of $374.7 million. A failure of one or more clinical trials can occur at any stage of testing. In some instances, we may rely on a single manufacturer for certain of our products. Such licenses may not be available on acceptable terms, if at all. The development and commercialization of new drug products is highly competitive. In addition, one member of our board of directors is associated with NEA. As a result of this volatility, our stockholders could incur substantial losses. In addition, our administrative staff are required to perform additional tasks. Item 1B. Unresolved Staff CommentsNone.

Summerized Form 10-K with GPT-2 https://www.sec.gov/Archives/edgar/data/1457612/000145761221000022/0001457612-21-000022.txt
Candlestick patterns

Candlestick patterns can be used as additional information for price prediction. Following list show which pattern applies on latest price information.

  • Meta analyst score 30.00/100

Institutional ownership list is based on filling form information

Holding name Date Amount
A - Artemis Wealth Advisors, LLC 2021-12-31 1137
A - Artemis Wealth Advisors, LLC 2022-03-31 1137


Bollinger Bollinger Bands for GENOCEA BIOSCIENCES INC can provide the information where the market is moving based on price information.


GENOCEA BIOSCIENCES INC Short Volume Ratio is shown in the diagram. Short volume sales can be seen as an investor sentiment.


Converting prices to returns GENOCEA BIOSCIENCES INC.


On-Balance Volume information for GENOCEA BIOSCIENCES INC. On-Balance Volume information can be an indicator for bullish or bearish outcome.


Accumulation / Distribution (A/D) indicator information for GENOCEA BIOSCIENCES INC. The indicator identify divergences between price and volume flow.


Aroon Oscillator information for GENOCEA BIOSCIENCES INC. The trend-following indicator can show the strengh of a current trend and likelihood that trend can continue.


Average Directional Index (ADX) information for GENOCEA BIOSCIENCES INC. The index can be used to identify the strengh of a trend.


Moving Average Convergence Divergence (MACD) for GENOCEA BIOSCIENCES INC. The indicator helps to predict trend direction and the momentum of the trend.


Stochastic Oscillator as momentum indicator for GENOCEA BIOSCIENCES INC. The indicator is useful for identifying overbought and oversold levels.


Relative Strength Index (RSI) for GENOCEA BIOSCIENCES INC. RSI is a momentum oscillator that measures the speed and change of price development. The momentum indicator was created by analyst Welles Wilder. The result compares recent gains and losses over restricted time period. Primary usage of the indicator is to identify overbought or oversold signals. When RSI indicator reaches a value of 70 it could mean that speculators should consider selling, suggests Wilder and Chong. Or vice versa when selling excess at which the RSI Indicators show a value of 30 [ Relative Strength Index for Developing Effective Trading Strategies in Constructing Optimal Portfolio ].


Heikin Ashi trading signals are generated based on the Heikin Ashi candles, which are a type of candlestick that smooths out the price action and can help to identify trends. Heikin Ashi signals can be used to identify both long and short trading opportunities.


The awesome oscillator is a momentum indicator that measures the speed and strength of price movements. It is calculated by subtracting a 34-period simple moving average (SMA) from a 5-period SMA.


The Parabolic SAR indicator is a trend-following indicator that uses a series of dots to indicate when a trend is likely to reverse. The Parabolic SAR is a lagging indicator, meaning that it does not predict reversals, but rather confirms them after they have already occurred.


Moving Average Crossover


52W High 52W Low Market Cap

Similar shares


GENOCEA BIOSCIENCES INC on Nasdaq

GENOCEA BIOSCIENCES INC on finviz

Figure below show the stock predictions.
Date Closing price Prediction was updated

The forecast (dashed curve) of the share price performance is based on historical data. Our forecast model is based on mathematical, statistical methods. The website offers price forecasts and analysis tools for equities and other securities, which are exclusively based on the prices of these securities in the past. Information about these prices is provided to us by third parties. Although we believe, If we believe that our sources are reliable, we cannot guarantee the accuracy, completeness, timeliness and correct sequencing of this information. We do not investigate the issuers of the securities to which our forecasts relate, nor do we consider any financial data or other data of such issuers with the exception of the past prices of the securities. Therefore, our forecasts do not constitute an analysis of other commercial or financial factors or circumstances, that may be relevant for future security price flows. Investments require additional considerations. Our forecasts cannot reflect the specific situation. Experience and risk profile of an individual investor or the tax implications an investment may have for the investor. Although we believe that our mathematical models are a tool to try to explore the possibility for future price development with the help of past performance, such developments are subject to a multitude of different influences. and therefore not really predictable. We cannot guarantee the success of any investment you make based on the information published here. This website is for information purposes only. All information and data on this website cannot be guaranteed to be accurate, accuracy, completeness and appropriateness - neither explicit nor implicit.