VENATOR MATERIALS PLC stock forecast: down to 0.00 USD VNTR stock price prognosis

STOCK

Forecast for Fri 07 Jul 2023 price 0.41

VENATOR MATERIALS PLC stock price forecast for further price development down to 0.00% (time horizon: 1 day) and price target of 0.00 USD. Short-term (time horizon: 2 weeks) VENATOR MATERIALS PLC share price prediction for 2023-07-07 with daily closed price projections

Key Facts

Symbol VNTR 

CUSIP G9329Z100


Currency USD


Category Industrial Inorganic Chemicals

Forecast price change %

Relative Strength Index (RSI)

Finance numbers

Revenue 1,959,000,000.0


Earnings per share -1.32


On our site we made daily predictions for finance products based on statistical analysis. You can export / download forecasted data as CSV file, no login required. The information can be used for day trading.

Summerized Form 10-K with GPT-2

Business4ITEM 1A. Risk Factors17ITEM 1B. Unresolved Staff Comments40ITEM 2. Selected Financial Data45ITEM 7. Executive Compensation116ITEM 12. Within these end markets, our products serve approximately 3,400 customers globally. For the year ended December 31, 2020, we had total revenues of $1,938 million. We have a well-established position in each of the industries in which we operate. This seasonality is subject to global, regional, end-use application and other factors. Rutile TiO2 Anatase TiO2 Ultrafine TiO2Characteristics Most common form of TiO2. We are a leading global manufacturer of zinc and barium functional additives. Our coatings customers benefit from a consistent and quality product. Our investment in LPC is accounted for using the equity method. Upon closure, it is expected that DuPont's interest in Viance will transfer to IFF. Ltd. that manufactures products for Venator. Accordingly, barriers to entry, apart from capital availability, may be low. Sakai Chemical Industry Co. and Tayca Corporation. We also have licensed or sub-licensed intellectual property rights to third parties. On January 31, 2020, the U.K. withdrew from the EU. Environmental, Health and Safety Matters. Member states, however, may choose to apply the regulation at any time after publication. The classification will become mandatory in the U.K. beginning October 2021. The suspension was effective in France for one year beginning January 1, 2020. These locations are subject to a number of existing GHG related laws and regulations. We place considerable value on the growth and development of our employees. Sales volumes decreased by approximately 8% in 2020 compared to the prior year period. We are unable to predict the duration or severity of the current economic downturn. We cannot anticipate market acceptance of new products or future products. The regulation was adopted in February 2020 and will apply as of October 1, 2021. Our facilities are dependent on environmental permits to operate. We commenced our 2020 Business Improvement Program in the third quarter of 2020. SK Capital's interests may conflict with your interests as a shareholder. This arrangement may result in conflicts of interest between Huntsman and us. Certain Relationships and Related Party Transactions, and Director Independence. Financial Statements and Supplementary Data—Note 19. We are incorporated under the laws of England and Wales. Any such shares will be evidenced by a receipt issued by the depositary. The deadline for such payment was May 13, 2019. The gas cloud quickly dissipated but temporarily created an off-site visual impact. MINE SAFETY DISCLOSURESNot applicable.43Table of ContentsPART IIITEM 5. We expect that this program will be fully implemented by the end of 2022. For more information concerning restructuring activities, see "Part II. The average specialty TiO2 price was stable compared to the prior year. For further discussion of these plans and the costs involved, see "Part II. Financing ArrangementsFor a discussion of financing arrangements, see "Part II. Derivative Instruments and Hedging Activities" of this report. For a discussion of EHS matters, see "Part II. These conclusions require significant judgment. Income Taxes" of this report for more information regarding our valuation allowances. The application of income tax law is inherently complex. For further information, see "Part II. We are subject to legal proceedings and claims arising out of our busi

Summerized Form 10-K with GPT-2 https://www.sec.gov/Archives/edgar/data/1705682/000170568221000005/0001705682-21-000005.txt
Candlestick patterns

Candlestick patterns can be used as additional information for price prediction. Following list show which pattern applies on latest price information.

  • Meta analyst score 43.40/100
    • Not in ideal financial position.
    • Historical view, profit is growing.
    • Company revenue is not growing faster compared with the industry.
    • Stock price is under book price value.

Institutional ownership list is based on filling form information

Holding name Date Amount
JPMORGAN CHASE & CO 2023-03-31 9
Wedmont Private Capital 2023-03-31 63432
Wedmont Private Capital 2022-09-30 63432
Wedmont Private Capital 2022-12-31 63432
NEW YORK STATE COMMON RETIREMENT FUND 2022-12-31 21727

Fund ownership list is based on filling form information

Fund name Date Amount Profile
SEI INSTITUTIONAL INVESTMENTS TRUST 2023-11-30 95747954 Long
INTEGRITY FUNDS 2023-10-31 1702576 Long
Invesco Exchange-Traded Self-Indexed Fund Trust 2023-02-28 13769 Long
John Hancock Variable Insurance Trust 2022-12-31 2700 Long
Ohio National Fund, Inc. 2023-03-31 55792 Long


Bollinger Bollinger Bands for VENATOR MATERIALS PLC can provide the information where the market is moving based on price information.


VENATOR MATERIALS PLC Short Volume Ratio is shown in the diagram. Short volume sales can be seen as an investor sentiment.


Converting prices to returns VENATOR MATERIALS PLC.


On-Balance Volume information for VENATOR MATERIALS PLC. On-Balance Volume information can be an indicator for bullish or bearish outcome.


Accumulation / Distribution (A/D) indicator information for VENATOR MATERIALS PLC. The indicator identify divergences between price and volume flow.


Aroon Oscillator information for VENATOR MATERIALS PLC. The trend-following indicator can show the strengh of a current trend and likelihood that trend can continue.


Average Directional Index (ADX) information for VENATOR MATERIALS PLC. The index can be used to identify the strengh of a trend.


Moving Average Convergence Divergence (MACD) for VENATOR MATERIALS PLC. The indicator helps to predict trend direction and the momentum of the trend.


Stochastic Oscillator as momentum indicator for VENATOR MATERIALS PLC. The indicator is useful for identifying overbought and oversold levels.


Relative Strength Index (RSI) for VENATOR MATERIALS PLC. RSI is a momentum oscillator that measures the speed and change of price development. The momentum indicator was created by analyst Welles Wilder. The result compares recent gains and losses over restricted time period. Primary usage of the indicator is to identify overbought or oversold signals. When RSI indicator reaches a value of 70 it could mean that speculators should consider selling, suggests Wilder and Chong. Or vice versa when selling excess at which the RSI Indicators show a value of 30 [ Relative Strength Index for Developing Effective Trading Strategies in Constructing Optimal Portfolio ].


Heikin Ashi trading signals are generated based on the Heikin Ashi candles, which are a type of candlestick that smooths out the price action and can help to identify trends. Heikin Ashi signals can be used to identify both long and short trading opportunities.


The awesome oscillator is a momentum indicator that measures the speed and strength of price movements. It is calculated by subtracting a 34-period simple moving average (SMA) from a 5-period SMA.


The Parabolic SAR indicator is a trend-following indicator that uses a series of dots to indicate when a trend is likely to reverse. The Parabolic SAR is a lagging indicator, meaning that it does not predict reversals, but rather confirms them after they have already occurred.


Moving Average Crossover


52W High 52W Low Market Cap

Similar shares


VENATOR MATERIALS PLC on Nasdaq

VENATOR MATERIALS PLC on finviz

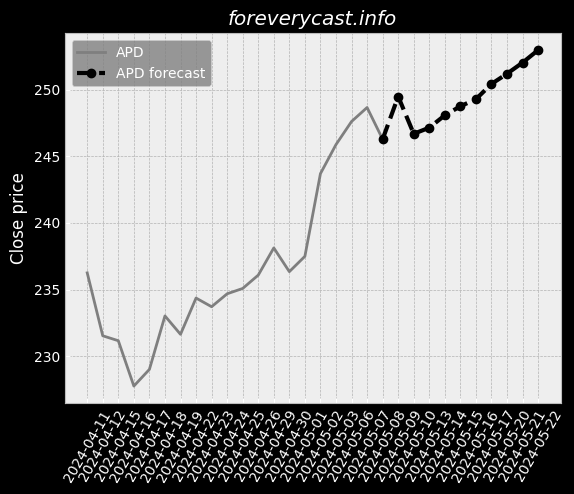
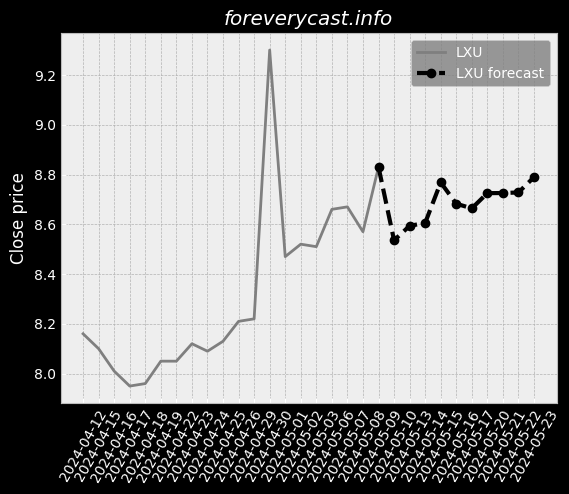
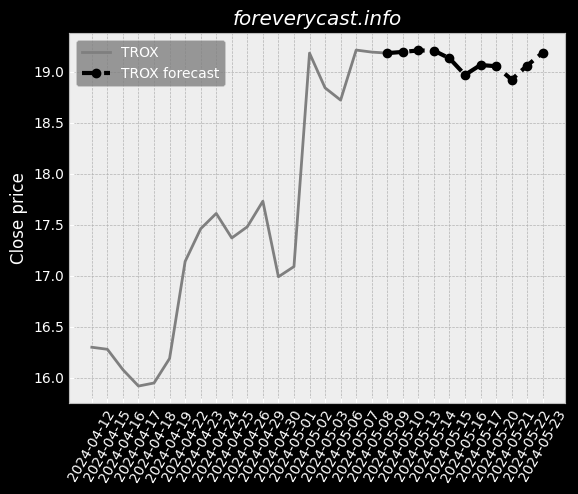
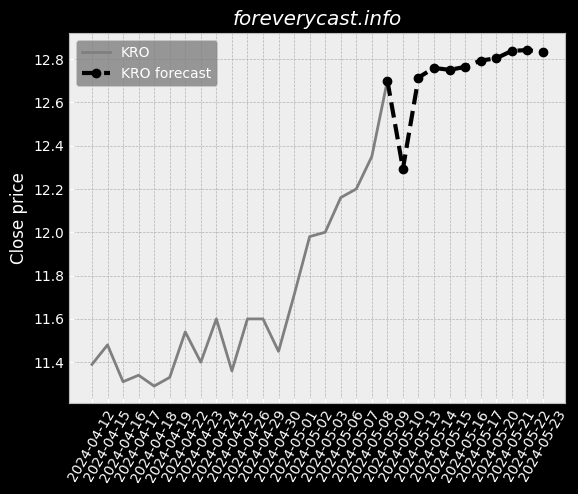
Figure below show the stock predictions.
Date Closing price Prediction was updated

The forecast (dashed curve) of the share price performance is based on historical data. Our forecast model is based on mathematical, statistical methods. The website offers price forecasts and analysis tools for equities and other securities, which are exclusively based on the prices of these securities in the past. Information about these prices is provided to us by third parties. Although we believe, If we believe that our sources are reliable, we cannot guarantee the accuracy, completeness, timeliness and correct sequencing of this information. We do not investigate the issuers of the securities to which our forecasts relate, nor do we consider any financial data or other data of such issuers with the exception of the past prices of the securities. Therefore, our forecasts do not constitute an analysis of other commercial or financial factors or circumstances, that may be relevant for future security price flows. Investments require additional considerations. Our forecasts cannot reflect the specific situation. Experience and risk profile of an individual investor or the tax implications an investment may have for the investor. Although we believe that our mathematical models are a tool to try to explore the possibility for future price development with the help of past performance, such developments are subject to a multitude of different influences. and therefore not really predictable. We cannot guarantee the success of any investment you make based on the information published here. This website is for information purposes only. All information and data on this website cannot be guaranteed to be accurate, accuracy, completeness and appropriateness - neither explicit nor implicit.