USD/MNT Prognosis: up to 3470.93 US-Dollar to Mongolian Tugrik Converter, Analysis, Prediction Forex Forecast

CURRENCY

Exchange rate (USD - MNT) forecast for Wed 01 Jan 2025 rate 3462.62 MNT

USD/MNT Forecast, US-Dollar to Mongolian Tugrik foreign exchange rate prediction. Short-term (time horizon: 1 day) USD to MNT Forex (FX) prognosis for 2025-01-01 with daily FX rate projections. Custom value / amount input USD <-> MNT to simplify statistical analysis

Key Facts

Symbol USDMNT 


Exchange rate USD - Mongolian Tugrik

Forecast price change %

Relative Strength Index (RSI)

Exchange amount

Calculate custom amount exchange

= next week trend = two weeks trend =
10 USD = next week trend = two weeks trend =
100 USD = next week trend = two weeks trend =
0.1 USD = next week trend = two weeks trend =
0.01 USD = next week trend = two weeks trend =
= next week trend = two weeks trend =
10 MNT = next week trend = two weeks trend =
100 MNT = next week trend = two weeks trend =
0.1 MNT = next week trend = two weeks trend =
0.01 MNT = next week trend = two weeks trend =

On our site we made daily predictions for finance products based on statistical analysis. You can export / download forecasted data as CSV file, no login required. The information can be used for day trading.

Candlestick patterns

Candlestick patterns can be used as additional information for price prediction. Following list show which pattern applies on latest price information.


Bollinger Bollinger Bands for Mongolian Tugrik can provide the information where the market is moving based on price information.


Converting prices to returns Mongolian Tugrik.


On-Balance Volume information for Mongolian Tugrik. On-Balance Volume information can be an indicator for bullish or bearish outcome.


Accumulation / Distribution (A/D) indicator information for Mongolian Tugrik. The indicator identify divergences between price and volume flow.


Aroon Oscillator information for Mongolian Tugrik. The trend-following indicator can show the strengh of a current trend and likelihood that trend can continue.


Average Directional Index (ADX) information for Mongolian Tugrik. The index can be used to identify the strengh of a trend.


Moving Average Convergence Divergence (MACD) for Mongolian Tugrik. The indicator helps to predict trend direction and the momentum of the trend.


Stochastic Oscillator as momentum indicator for Mongolian Tugrik. The indicator is useful for identifying overbought and oversold levels.


Relative Strength Index (RSI) for Mongolian Tugrik. RSI is a momentum oscillator that measures the speed and change of price development. The momentum indicator was created by analyst Welles Wilder. The result compares recent gains and losses over restricted time period. Primary usage of the indicator is to identify overbought or oversold signals. When RSI indicator reaches a value of 70 it could mean that speculators should consider selling, suggests Wilder and Chong. Or vice versa when selling excess at which the RSI Indicators show a value of 30 [ Relative Strength Index for Developing Effective Trading Strategies in Constructing Optimal Portfolio ].


Heikin Ashi trading signals are generated based on the Heikin Ashi candles, which are a type of candlestick that smooths out the price action and can help to identify trends. Heikin Ashi signals can be used to identify both long and short trading opportunities.


The awesome oscillator is a momentum indicator that measures the speed and strength of price movements. It is calculated by subtracting a 34-period simple moving average (SMA) from a 5-period SMA.


The Parabolic SAR indicator is a trend-following indicator that uses a series of dots to indicate when a trend is likely to reverse. The Parabolic SAR is a lagging indicator, meaning that it does not predict reversals, but rather confirms them after they have already occurred.


Moving Average Crossover


52W High 52W Low Market Cap

Similar currency

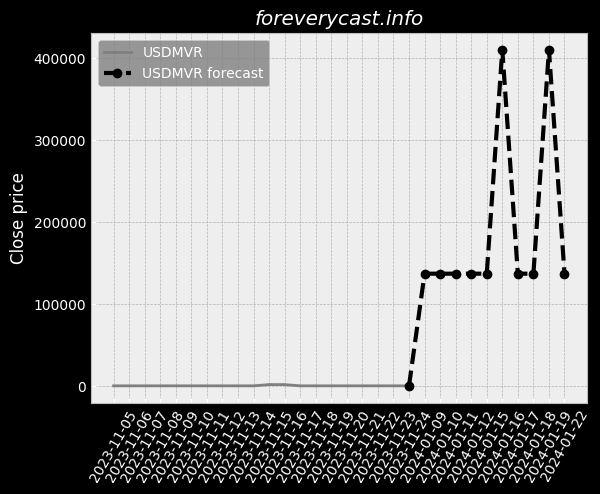
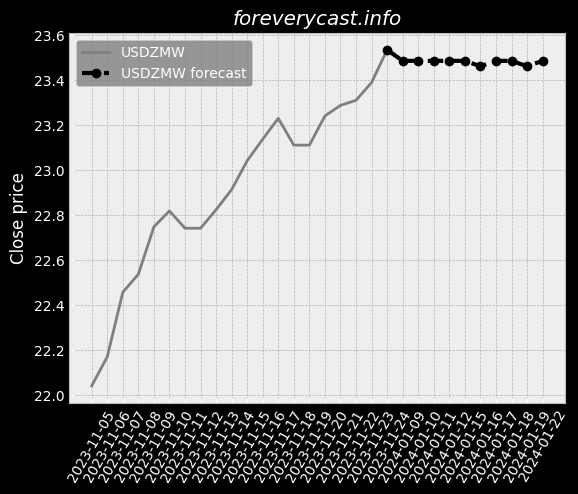
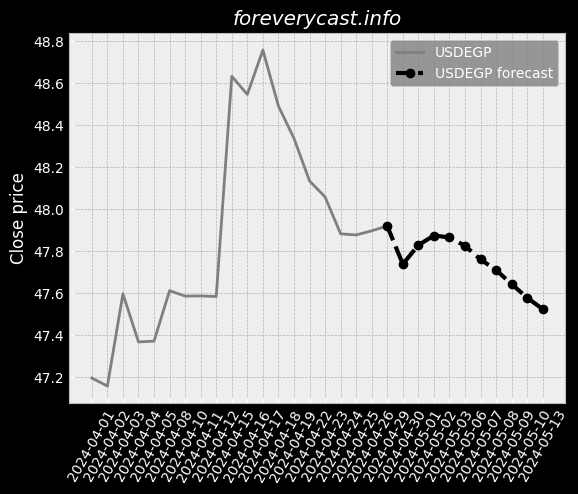
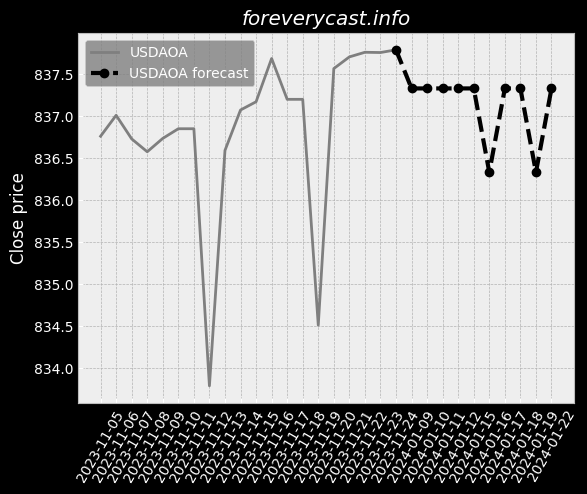
Figure below show the currency predictions.
Date Closing price Prediction was updated
2024-12-04 3470.93 2024-04-24 06:25
2024-12-05 3470.54 2024-04-24 06:25
2024-08-13 3463.97 2024-04-24 06:25
2024-08-14 3464.64 2024-04-24 06:25
2024-08-15 3465.29 2024-04-24 06:25
2024-08-16 3465.92 2024-04-24 06:25
2024-12-06 3470.15 2024-04-24 06:25
2024-12-11 3468.94 2024-04-24 06:25
2024-08-20 3467.21 2024-04-24 06:25
2024-08-21 3467.84 2024-04-24 06:25
2024-08-23 3469.03 2024-04-24 06:25
2024-12-18 3466.87 2024-04-24 06:25
2024-12-16 3467.71 2024-04-24 06:25
2024-12-17 3467.29 2024-04-24 06:25
2024-12-19 3466.45 2024-04-24 06:25
2024-12-23 3465.60 2024-04-24 06:25
2024-12-24 3465.18 2024-04-24 06:25
2024-12-20 3466.02 2024-04-24 06:25
2024-12-12 3468.53 2024-04-24 06:25
2024-12-02 3471.69 2024-04-24 06:25
2024-12-03 3471.31 2024-04-24 06:25
2024-12-09 3469.75 2024-04-24 06:25
2024-12-10 3469.35 2024-04-24 06:25
2024-12-13 3468.12 2024-04-24 06:25
2024-11-25 3473.50 2024-04-24 06:25
2024-11-26 3473.15 2024-04-24 06:25
2024-12-30 3463.47 2024-04-24 06:25
2024-12-31 3463.05 2024-04-24 06:25
2024-12-27 3463.90 2024-04-24 06:25
2025-01-01 3462.62 2024-04-24 06:25
2024-12-25 3464.75 2024-04-24 06:25
2024-12-26 3464.33 2024-04-24 06:25
2024-05-15 3413.76 2024-04-24 06:25
2024-07-23 3452.35 2024-04-24 06:25
2024-10-02 3478.87 2024-04-24 06:25
2024-08-30 3471.72 2024-04-24 06:25
2024-06-04 3422.48 2024-04-24 06:25
2024-07-17 3448.93 2024-04-24 06:25
2024-06-06 3424.06 2024-04-24 06:25
2024-06-18 3430.51 2024-04-24 06:25
2024-06-20 3432.09 2024-04-24 06:25
2024-06-21 3432.99 2024-04-24 06:25
2024-06-24 3433.92 2024-04-24 06:25
2024-06-28 3437.38 2024-04-24 06:25
2024-07-01 3438.24 2024-04-24 06:25
2024-05-16 3414.39 2024-04-24 06:25
2024-05-17 3414.88 2024-04-24 06:25
2024-05-20 3415.45 2024-04-24 06:25
2024-05-21 3415.79 2024-04-24 06:25
2024-05-22 3416.31 2024-04-24 06:25
2024-05-23 3416.96 2024-04-24 06:25
2024-05-24 3417.67 2024-04-24 06:25
2024-11-27 3472.80 2024-04-24 06:25
2024-04-25 3409.44 2024-04-24 06:25
2024-04-26 3409.78 2024-04-24 06:25
2024-04-29 3409.90 2024-04-24 06:25
2024-07-10 3444.47 2024-04-24 06:25
2024-07-12 3446.31 2024-04-24 06:25
2024-07-29 3455.62 2024-04-24 06:25
2024-07-30 3456.41 2024-04-24 06:25
2024-07-31 3457.23 2024-04-24 06:25
2024-07-18 3449.75 2024-04-24 06:25
2024-07-19 3450.59 2024-04-24 06:25
2024-07-22 3451.47 2024-04-24 06:25
2024-11-08 3476.80 2024-04-24 06:25
2024-04-30 3410.26 2024-04-24 06:25
2024-05-01 3410.00 2024-04-24 06:25
2024-11-06 3477.27 2024-04-24 06:25
2024-05-10 3412.32 2024-04-24 06:25
2024-05-13 3412.70 2024-04-24 06:25
2024-05-14 3413.18 2024-04-24 06:25
2024-07-24 3453.22 2024-04-24 06:25
2024-07-26 3454.84 2024-04-24 06:25
2024-08-02 3458.85 2024-04-24 06:25
2024-08-07 3461.05 2024-04-24 06:25
2024-08-08 3461.78 2024-04-24 06:25
2024-10-25 3478.70 2024-04-24 06:25
2024-05-30 3420.25 2024-04-24 06:25
2024-05-31 3420.90 2024-04-24 06:25
2024-06-03 3421.67 2024-04-24 06:25
2024-07-04 3441.04 2024-04-24 06:25
2024-07-25 3454.04 2024-04-24 06:25
2024-08-26 3469.58 2024-04-24 06:25
2024-08-27 3470.12 2024-04-24 06:25
2024-08-29 3471.19 2024-04-24 06:25
2024-09-12 3475.56 2024-04-24 06:25
2024-09-23 3477.62 2024-04-24 06:25
2024-09-24 3477.84 2024-04-24 06:25
2024-05-02 3410.22 2024-04-24 06:25
2024-05-03 3410.54 2024-04-24 06:25
2024-05-06 3410.98 2024-04-24 06:25
2024-05-07 3411.43 2024-04-24 06:25
2024-05-08 3411.77 2024-04-24 06:25
2024-05-09 3412.19 2024-04-24 06:25
2024-05-27 3418.42 2024-04-24 06:25
2024-05-28 3419.05 2024-04-24 06:25
2024-05-29 3419.72 2024-04-24 06:25
2024-07-05 3441.92 2024-04-24 06:25
2024-07-08 3442.77 2024-04-24 06:25
2024-07-09 3443.61 2024-04-24 06:25
2024-07-11 3445.39 2024-04-24 06:25
2024-07-15 3447.23 2024-04-24 06:25
2024-07-16 3448.09 2024-04-24 06:25
2024-08-01 3458.05 2024-04-24 06:25
2024-08-05 3459.61 2024-04-24 06:25
2024-08-06 3460.34 2024-04-24 06:25
2024-08-09 3462.52 2024-04-24 06:25
2024-08-12 3463.25 2024-04-24 06:25
2024-09-03 3472.69 2024-04-24 06:25
2024-09-06 3473.99 2024-04-24 06:25
2024-09-09 3474.41 2024-04-24 06:25
2024-09-10 3474.83 2024-04-24 06:25
2024-09-11 3475.21 2024-04-24 06:25
2024-09-13 3475.89 2024-04-24 06:25
2024-10-11 3479.33 2024-04-24 06:25
2024-10-14 3479.32 2024-04-24 06:25
2024-10-15 3479.31 2024-04-24 06:25
2024-10-17 3479.25 2024-04-24 06:25
2024-10-18 3479.20 2024-04-24 06:25
2024-10-21 3479.13 2024-04-24 06:25
2024-10-22 3479.05 2024-04-24 06:25
2024-10-24 3478.83 2024-04-24 06:25
2024-10-30 3478.27 2024-04-24 06:25
2024-10-31 3478.09 2024-04-24 06:25
2024-11-01 3477.90 2024-04-24 06:25
2024-11-04 3477.70 2024-04-24 06:25
2024-11-15 3475.43 2024-04-24 06:25
2024-11-18 3475.14 2024-04-24 06:25
2024-11-19 3474.83 2024-04-24 06:25
2024-08-28 3470.65 2024-04-24 06:25
2024-09-02 3472.22 2024-04-24 06:25
2024-09-16 3476.21 2024-04-24 06:25
2024-09-25 3478.04 2024-04-24 06:25
2024-09-26 3478.24 2024-04-24 06:25
2024-09-27 3478.43 2024-04-24 06:25
2024-10-09 3479.28 2024-04-24 06:25
2024-10-10 3479.31 2024-04-24 06:25
2024-11-21 3474.17 2024-04-24 06:25
2024-11-28 3472.44 2024-04-24 06:25
2024-11-05 3477.49 2024-04-24 06:25
2024-11-07 3477.04 2024-04-24 06:25
2024-11-29 3472.07 2024-04-24 06:25
2024-06-05 3423.32 2024-04-24 06:25
2024-06-07 3424.82 2024-04-24 06:25
2024-06-10 3425.48 2024-04-24 06:25
2024-06-11 3426.23 2024-04-24 06:25
2024-06-12 3427.09 2024-04-24 06:25
2024-06-13 3427.97 2024-04-24 06:25
2024-06-14 3428.87 2024-04-24 06:25
2024-06-17 3429.69 2024-04-24 06:25
2024-06-19 3431.27 2024-04-24 06:25
2024-06-25 3434.85 2024-04-24 06:25
2024-06-26 3435.71 2024-04-24 06:25
2024-06-27 3436.57 2024-04-24 06:25
2024-07-02 3439.16 2024-04-24 06:25
2024-07-03 3440.10 2024-04-24 06:25
2024-09-17 3476.52 2024-04-24 06:25
2024-09-18 3476.83 2024-04-24 06:25
2024-09-19 3477.12 2024-04-24 06:25
2024-09-20 3477.39 2024-04-24 06:25
2024-09-30 3478.60 2024-04-24 06:25
2024-10-03 3478.97 2024-04-24 06:25
2024-10-04 3479.06 2024-04-24 06:25
2024-10-07 3479.14 2024-04-24 06:25
2024-10-08 3479.22 2024-04-24 06:25
2024-11-22 3473.84 2024-04-24 06:25
2024-10-28 3478.57 2024-04-24 06:25
2024-10-29 3478.43 2024-04-24 06:25
2024-11-20 3474.50 2024-04-24 06:25
2024-08-19 3466.56 2024-04-24 06:25
2024-08-22 3468.45 2024-04-24 06:25
2024-09-04 3473.13 2024-04-24 06:25
2024-09-05 3473.56 2024-04-24 06:25
2024-10-01 3478.75 2024-04-24 06:25
2024-10-16 3479.28 2024-04-24 06:25
2024-10-23 3478.94 2024-04-24 06:25
2024-11-14 3475.72 2024-04-24 06:25
2024-11-11 3476.54 2024-04-24 06:25
2024-11-12 3476.28 2024-04-24 06:25
2024-11-13 3476.00 2024-04-24 06:25
Table bellow show Bot decisions related with product
Decision Date Bot Decision Money # Portfolio Value
2020-11-28 Mongolian Tugrik buy 0.00 12139499 34660508173.66
2020-11-29 Mongolian Tugrik sell 4251.74 0 4251.74
2020-12-20 Mongolian Tugrik buy 0.00 12157015 34710557329.57
2020-12-21 Mongolian Tugrik hold 0.00 12157015 34693404206.70
2020-12-22 Mongolian Tugrik sell 4248.82 0 4248.82
2020-09-12 Mongolian Tugrik buy 0.00 11685975 33395087751.42
2020-09-13 Mongolian Tugrik sell 4089.28 0 4089.28
2020-09-16 Mongolian Tugrik buy 0.00 11708900 33526240356.61
2020-09-17 Mongolian Tugrik sell 4086.60 0 4086.60
2020-11-22 Mongolian Tugrik buy 0.00 11709416 33434908028.21
2020-11-23 Mongolian Tugrik sell 4102.89 0 4102.89
2021-07-23 Mongolian Tugrik buy 0.00 12289243 35001172932.97
2021-07-24 Mongolian Tugrik hold 0.00 12289243 35001172932.97
2021-07-25 Mongolian Tugrik hold 0.00 12289243 35001172932.97
2021-07-26 Mongolian Tugrik sell 4314.87 0 4314.87
2021-08-27 Mongolian Tugrik buy 0.00 12450771 35495918065.47
2021-08-28 Mongolian Tugrik hold 0.00 12450771 35495918065.47
2021-08-29 Mongolian Tugrik hold 0.00 12450771 35495918065.47
2021-08-30 Mongolian Tugrik sell 4367.31 0 4367.31
2021-09-03 Mongolian Tugrik buy 0.00 12450771 35495918065.47
2021-09-04 Mongolian Tugrik sell 4367.31 0 4367.31
2021-09-06 Mongolian Tugrik buy 0.00 12450771 35495918065.47
2021-09-07 Mongolian Tugrik hold 0.00 12450771 35495918065.47
2021-09-08 Mongolian Tugrik sell 4367.31 0 4367.31
2021-10-15 Mongolian Tugrik buy 0.00 12357162 35229335482.14
2021-10-16 Mongolian Tugrik hold 0.00 12357162 35229335482.14
2021-10-17 Mongolian Tugrik sell 4334.44 0 4334.44
2021-11-09 Mongolian Tugrik buy 0.00 12201536 34785658138.37
2021-11-10 Mongolian Tugrik sell 4279.85 0 4279.85
2021-11-13 Mongolian Tugrik buy 0.00 12232754 34963885885.35
2021-11-14 Mongolian Tugrik sell 4279.85 0 4279.85
2021-12-28 Mongolian Tugrik buy 0.00 12208760 34897332466.50
2021-12-29 Mongolian Tugrik hold 0.00 12208760 34897332466.50
2021-12-30 Mongolian Tugrik sell 4271.21 0 4271.21
2022-01-02 Mongolian Tugrik buy 0.00 12208760 34897332466.50
2022-01-03 Mongolian Tugrik sell 4271.21 0 4271.21
2022-01-16 Mongolian Tugrik buy 0.00 12198497 34873443983.93
2022-01-17 Mongolian Tugrik sell 4266.95 0 4266.95
2022-01-24 Mongolian Tugrik buy 0.00 12076665 34525146628.64
2022-01-25 Mongolian Tugrik hold 0.00 12076665 34525146628.64
2022-01-26 Mongolian Tugrik hold 0.00 12076665 34525146628.64
2022-01-27 Mongolian Tugrik sell 4224.34 0 4224.34
2022-03-25 Mongolian Tugrik buy 0.00 12035826 34648407057.21
2022-03-26 Mongolian Tugrik sell 4180.89 0 4180.89
2022-04-01 Mongolian Tugrik buy 0.00 12108258 34856922656.34
2022-04-02 Mongolian Tugrik hold 0.00 12108258 34856922656.34
2022-04-03 Mongolian Tugrik sell 4206.05 0 4206.05
2022-04-16 Mongolian Tugrik buy 0.00 12783311 38284268846.63
2022-04-17 Mongolian Tugrik hold 0.00 12783311 38284268846.63
2022-04-18 Mongolian Tugrik sell 4268.41 0 4268.41
2022-04-28 Mongolian Tugrik buy 0.00 12729798 38124003719.92
2022-04-29 Mongolian Tugrik sell 4250.54 0 4250.54
2022-05-23 Mongolian Tugrik buy 0.00 12553347 38611219253.67
2022-05-24 Mongolian Tugrik hold 0.00 12553347 38611219253.67
2022-05-25 Mongolian Tugrik sell 4081.37 0 4081.37
2022-06-05 Mongolian Tugrik buy 0.00 12528031 38533352577.60
2022-06-06 Mongolian Tugrik hold 0.00 12528031 38533352577.60
2022-06-07 Mongolian Tugrik hold 0.00 12528031 38533352577.60
2022-06-08 Mongolian Tugrik hold 0.00 12528031 38533352577.60
2022-06-09 Mongolian Tugrik sell 4073.14 0 4073.14
2022-06-10 Mongolian Tugrik buy 0.00 12528031 38533352577.60
2022-06-11 Mongolian Tugrik sell 4073.14 0 4073.14
2022-06-20 Mongolian Tugrik buy 0.00 12731400 39774008281.25
2022-06-21 Mongolian Tugrik hold 0.00 12731400 39774008281.25
2022-06-22 Mongolian Tugrik hold 0.00 12731400 39774008281.25
2022-06-23 Mongolian Tugrik hold 0.00 12731400 39774008281.25
2022-06-24 Mongolian Tugrik sell 4075.24 0 4075.24
2022-06-25 Mongolian Tugrik buy 0.00 12731400 39774008281.25
2022-06-26 Mongolian Tugrik sell 4075.24 0 4075.24
2022-10-02 Mongolian Tugrik buy 0.00 12897837 40293971807.22
2022-10-04 Mongolian Tugrik sell 3847.32 0 3847.32
2022-10-06 Mongolian Tugrik buy 0.00 12906570 43297541840.97
2022-10-09 Mongolian Tugrik sell 3841.44 0 3841.44
2022-10-19 Mongolian Tugrik buy 0.00 12913967 43567205633.32
2022-10-20 Mongolian Tugrik sell 3826.89 0 3826.89
2022-10-24 Mongolian Tugrik buy 0.00 12927629 43670824424.09
2022-10-25 Mongolian Tugrik sell 3822.04 0 3822.04
2022-11-03 Mongolian Tugrik buy 0.00 12966308 43988330601.90
2022-11-06 Mongolian Tugrik sell 3816.90 0 3816.90
2022-11-08 Mongolian Tugrik buy 0.00 12977377 44122823319.18
2022-11-09 Mongolian Tugrik sell 3817.36 0 3817.36
2022-12-14 Mongolian Tugrik buy 0.00 12935504 44354161257.75
2022-12-13 Mongolian Tugrik sell 3772.53 0 3772.53
2022-12-12 Mongolian Tugrik buy 0.00 12934712 44322988436.26
2022-12-15 Mongolian Tugrik hold 0.00 12935504 44360111589.54
2022-12-18 Mongolian Tugrik sell 3769.01 0 3769.01

The forecast (dashed curve) of the share price performance is based on historical data. Our forecast model is based on mathematical, statistical methods. The website offers price forecasts and analysis tools for equities and other securities, which are exclusively based on the prices of these securities in the past. Information about these prices is provided to us by third parties. Although we believe, If we believe that our sources are reliable, we cannot guarantee the accuracy, completeness, timeliness and correct sequencing of this information. We do not investigate the issuers of the securities to which our forecasts relate, nor do we consider any financial data or other data of such issuers with the exception of the past prices of the securities. Therefore, our forecasts do not constitute an analysis of other commercial or financial factors or circumstances, that may be relevant for future security price flows. Investments require additional considerations. Our forecasts cannot reflect the specific situation. Experience and risk profile of an individual investor or the tax implications an investment may have for the investor. Although we believe that our mathematical models are a tool to try to explore the possibility for future price development with the help of past performance, such developments are subject to a multitude of different influences. and therefore not really predictable. We cannot guarantee the success of any investment you make based on the information published here. This website is for information purposes only. All information and data on this website cannot be guaranteed to be accurate, accuracy, completeness and appropriateness - neither explicit nor implicit.