SPEM etf prediction: down to 34.12 USD SPDR Index Shares Fund Portfolio Emerging Markets fund price price prognosis
ETF
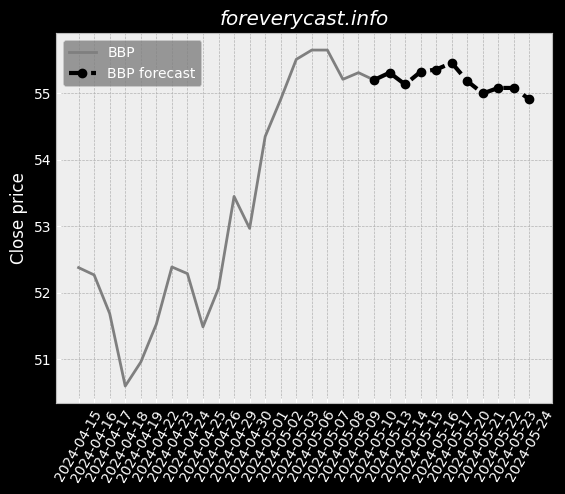
Forecast for Fri 27 Dec 2024 price 34.12
SPDR Index Shares Fund Portfolio Emerging Markets etf price forecast for further price development down to -5.30% (time horizon: 1 day) and price target of 34.12 USD. Short-term (time horizon: 2 weeks) SPDR Index Shares Fund Portfolio Emerging Markets fund price prediction for 2024-12-27 with daily closed price projections
Key Facts
Symbol SPEM
ISIN US78463X5095
CUSIP 78463X509
Currency USD
Forecast price change %
Relative Strength Index (RSI)
Finance numbers
Total Assets 8,574,641,545.54
Total Liabilities 255,710,936.86
Net Assets 8,318,930,608.68