AG MORTGAGE INVESTMENT TRUST REIT stock forecast: down to 5.66 USD MITT stock price prognosis

STOCK

Forecast for Tue 18 Jun 2024 price 5.79

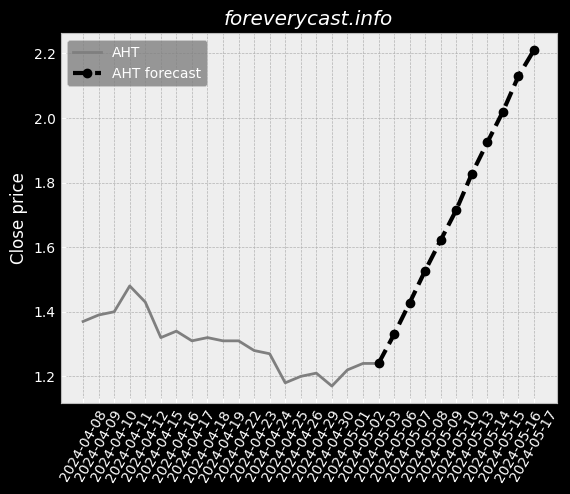
AG MORTGAGE INVESTMENT TRUST REIT stock price forecast for further price development down to -8.12% (time horizon: 1 day) and price target of 5.66 USD. Short-term (time horizon: 2 weeks) AG MORTGAGE INVESTMENT TRUST REIT share price prediction for 2024-06-18 with daily closed price projections

Key Facts

Symbol MITT 

ISIN US0012281053 

CUSIP 001228105


Currency USD


Category Real Estate Investment Trusts

Forecast price change %

Relative Strength Index (RSI)

Finance numbers

Earnings per share -12.24


Dividends 0.03

On our site we made daily predictions for finance products based on statistical analysis. You can export / download forecasted data as CSV file, no login required. The information can be used for day trading.

Summerized Form 10-K with GPT-2

Our Credit Investments include Residential Investments and Commercial Investments. All of our officers are employees of Angelo Gordon or its affiliates. These investments are described in more detail below. 8226;Non-QM Loans in securitized form that are issued by MATT. The securitizations typically take the form of various classes of notes. We may change our strategy and policies without a vote of our stockholders. 8226;Our financing arrangements contain restrictive operating covenants. &# These risks may have an adverse impact on our business and our liquidity. All valuation models rely on correct market data inputs. COVID-19 effect on servicer liquidity. There is risk that our assumptions prove to be incorrect. The process of transition involves operational risks. It is also possible that no transition will occur for many financial instruments. These affiliates may have meaningful purchasing capacity. Our Manager maintains a contractual as opposed to a fiduciary relationship with us. Complying with the REIT requirements may limit our ability to hedge effectively.

Summerized Form 10-K with GPT-2 https://www.sec.gov/Archives/edgar/data/1514281/000151428121000025/0001514281-21-000025.txt
Candlestick patterns

Candlestick patterns can be used as additional information for price prediction. Following list show which pattern applies on latest price information.

  • Meta analyst score 56.04/100
    • Good financial position.
    • Historical view, profit is growing.
    • Company revenue is not growing faster compared with the industry.

Institutional ownership list is based on filling form information

Holding name Date Amount
MetLife Investment Management, LLC 2020-03-31 14345
MetLife Investment Management, LLC 2019-12-31 14345
MetLife Investment Management, LLC 2019-09-30 14345
MetLife Investment Management, LLC 2019-06-30 14345
MetLife Investment Management, LLC 2019-03-31 14345


Bollinger Bollinger Bands for AG MORTGAGE INVESTMENT TRUST REIT can provide the information where the market is moving based on price information.


AG MORTGAGE INVESTMENT TRUST REIT Short Volume Ratio is shown in the diagram. Short volume sales can be seen as an investor sentiment.


Converting prices to returns AG MORTGAGE INVESTMENT TRUST REIT.


On-Balance Volume information for AG MORTGAGE INVESTMENT TRUST REIT. On-Balance Volume information can be an indicator for bullish or bearish outcome.


Accumulation / Distribution (A/D) indicator information for AG MORTGAGE INVESTMENT TRUST REIT. The indicator identify divergences between price and volume flow.


Aroon Oscillator information for AG MORTGAGE INVESTMENT TRUST REIT. The trend-following indicator can show the strengh of a current trend and likelihood that trend can continue.


Average Directional Index (ADX) information for AG MORTGAGE INVESTMENT TRUST REIT. The index can be used to identify the strengh of a trend.


Moving Average Convergence Divergence (MACD) for AG MORTGAGE INVESTMENT TRUST REIT. The indicator helps to predict trend direction and the momentum of the trend.


Stochastic Oscillator as momentum indicator for AG MORTGAGE INVESTMENT TRUST REIT. The indicator is useful for identifying overbought and oversold levels.


Relative Strength Index (RSI) for AG MORTGAGE INVESTMENT TRUST REIT. RSI is a momentum oscillator that measures the speed and change of price development. The momentum indicator was created by analyst Welles Wilder. The result compares recent gains and losses over restricted time period. Primary usage of the indicator is to identify overbought or oversold signals. When RSI indicator reaches a value of 70 it could mean that speculators should consider selling, suggests Wilder and Chong. Or vice versa when selling excess at which the RSI Indicators show a value of 30 [ Relative Strength Index for Developing Effective Trading Strategies in Constructing Optimal Portfolio ].


Heikin Ashi trading signals are generated based on the Heikin Ashi candles, which are a type of candlestick that smooths out the price action and can help to identify trends. Heikin Ashi signals can be used to identify both long and short trading opportunities.


The awesome oscillator is a momentum indicator that measures the speed and strength of price movements. It is calculated by subtracting a 34-period simple moving average (SMA) from a 5-period SMA.


The Parabolic SAR indicator is a trend-following indicator that uses a series of dots to indicate when a trend is likely to reverse. The Parabolic SAR is a lagging indicator, meaning that it does not predict reversals, but rather confirms them after they have already occurred.


Moving Average Crossover


52W High 52W Low Market Cap

Similar shares


AG MORTGAGE INVESTMENT TRUST REIT on Nasdaq

AG MORTGAGE INVESTMENT TRUST REIT on finviz

Figure below show the stock predictions.
Date Closing price Prediction was updated
2024-05-22 5.66 2024-04-23 06:18
2024-05-24 5.67 2024-04-23 06:18
2024-05-20 5.64 2024-04-23 06:18
2024-05-21 5.65 2024-04-23 06:18
2024-05-27 5.68 2024-04-23 06:18
2024-05-28 5.68 2024-04-23 06:18
2024-06-07 5.74 2024-04-23 06:18
2024-05-29 5.69 2024-04-23 06:18
2024-06-05 5.72 2024-04-23 06:18
2024-05-30 5.69 2024-04-23 06:18
2024-06-03 5.71 2024-04-23 06:18
2024-06-04 5.72 2024-04-23 06:18
2024-06-10 5.75 2024-04-23 06:18
2024-06-11 5.75 2024-04-23 06:18
2024-05-31 5.70 2024-04-23 06:18
2024-05-23 5.66 2024-04-23 06:18
2024-06-06 5.73 2024-04-23 06:18
2024-06-12 5.76 2024-04-23 06:18
2024-06-13 5.77 2024-04-23 06:18
2024-06-17 5.78 2024-04-23 06:18
2024-06-18 5.79 2024-04-23 06:18
2024-06-14 5.77 2024-04-23 06:18
2024-05-07 5.59 2024-04-23 06:18
2024-05-06 5.58 2024-04-23 06:18
2024-05-15 5.61 2024-04-23 06:18
2024-05-16 5.63 2024-04-23 06:18
2024-04-25 5.60 2024-04-23 06:18
2024-04-24 5.56 2024-04-23 06:18
2024-05-17 5.63 2024-04-23 06:18
2024-05-09 5.60 2024-04-23 06:18
2024-04-26 5.58 2024-04-23 06:18
2024-04-29 5.60 2024-04-23 06:18
2024-04-30 5.56 2024-04-23 06:18
2024-05-01 5.57 2024-04-23 06:18
2024-05-02 5.57 2024-04-23 06:18
2024-05-03 5.59 2024-04-23 06:18
2024-05-08 5.60 2024-04-23 06:18
2024-05-10 5.61 2024-04-23 06:18
2024-05-13 5.60 2024-04-23 06:18
2024-05-14 5.61 2024-04-23 06:18

The forecast (dashed curve) of the share price performance is based on historical data. Our forecast model is based on mathematical, statistical methods. The website offers price forecasts and analysis tools for equities and other securities, which are exclusively based on the prices of these securities in the past. Information about these prices is provided to us by third parties. Although we believe, If we believe that our sources are reliable, we cannot guarantee the accuracy, completeness, timeliness and correct sequencing of this information. We do not investigate the issuers of the securities to which our forecasts relate, nor do we consider any financial data or other data of such issuers with the exception of the past prices of the securities. Therefore, our forecasts do not constitute an analysis of other commercial or financial factors or circumstances, that may be relevant for future security price flows. Investments require additional considerations. Our forecasts cannot reflect the specific situation. Experience and risk profile of an individual investor or the tax implications an investment may have for the investor. Although we believe that our mathematical models are a tool to try to explore the possibility for future price development with the help of past performance, such developments are subject to a multitude of different influences. and therefore not really predictable. We cannot guarantee the success of any investment you make based on the information published here. This website is for information purposes only. All information and data on this website cannot be guaranteed to be accurate, accuracy, completeness and appropriateness - neither explicit nor implicit.