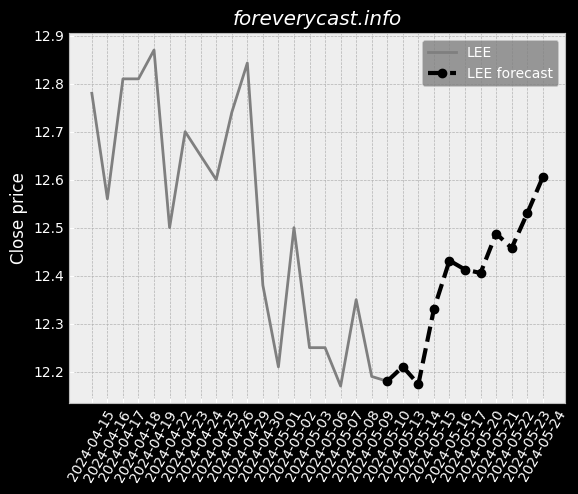
GANNETT INC stock forecast: up to 2.62 USD GCI stock price prognosis

STOCK

Forecast for Fri 14 Jun 2024 price 2.72

GANNETT INC stock price forecast for further price development up to 18.04% (time horizon: 1 day) and price target of 2.62 USD. Short-term (time horizon: 2 weeks) GANNETT INC share price prediction for 2024-06-14 with daily closed price projections

Key Facts

Symbol GCI 

ISIN US36472T1097 

CUSIP 36472T109


Currency USD


Category Newspapers: Publishing Or Publishing & Printing

Forecast price change %

Relative Strength Index (RSI)

Finance numbers

Revenue 3,234,072,000.0


Earnings per share -5.54


On our site we made daily predictions for finance products based on statistical analysis. You can export / download forecasted data as CSV file, no login required. The information can be used for day trading.

Summerized Form 10-K with GPT-2

Since 1918, our USA TODAY NETWORK newsrooms have won 96 Pulitzer Prizes. We are one of the industry leaders in the use of recycled newsprint. Declining subscriber volume can also lead to more marked declines in advertising revenue. For example, our business USA TODAY NETWORK Ventures produces local events. These risks also apply to other publishers with whom we do business, including Yahoo!, Our financial statements are denominated in U.S. dollars. On July 22, 2020, a Digital Services Tax ("DST") was enacted in the United Kingdom. Additionally, we depend on the security of our third-party service providers.

Summerized Form 10-K with GPT-2 https://www.sec.gov/Archives/edgar/data/1579684/000157968421000009/0001579684-21-000009.txt
Candlestick patterns

Candlestick patterns can be used as additional information for price prediction. Following list show which pattern applies on latest price information.

  • Meta analyst score 40.85/100
    • Not in ideal financial position.
    • Historical view, profit is not growing.
    • Company revenue is growing faster compared with the industry.

Institutional ownership list is based on filling form information

Holding name Date Amount
A - BARCLAYS PLC 2023-06-30 2544223
COOPERMAN LEON G 2022-06-30 2362100
COOPERMAN LEON G 2022-09-30 2627100
A - Atria Wealth Solutions, Inc. 2023-03-31 37614
A - OSAIC HOLDINGS, INC. 2023-06-30 20747

Fund ownership list is based on filling form information

Fund name Date Amount Profile
SCHWAB STRATEGIC TRUST 2023-11-30 1928624 Long
SCHWAB STRATEGIC TRUST 2023-11-30 11896 Long
SCHWAB STRATEGIC TRUST 2023-11-30 667879 Long
SCHWAB STRATEGIC TRUST 2023-11-30 85005 Long
MORGAN STANLEY PATHWAY FUNDS 2023-11-30 4982 Long

Insider trading for GANNETT INC

CIK Name Date Action T-Test 1day T-Test 7day T-Test 14day T-Test 30day
1376487 Reed Michael 2023-11-06 BUY Accept Accept Accept Accept


Bollinger Bollinger Bands for GANNETT INC can provide the information where the market is moving based on price information.


GANNETT INC Short Volume Ratio is shown in the diagram. Short volume sales can be seen as an investor sentiment.


Converting prices to returns GANNETT INC.


On-Balance Volume information for GANNETT INC. On-Balance Volume information can be an indicator for bullish or bearish outcome.


Accumulation / Distribution (A/D) indicator information for GANNETT INC. The indicator identify divergences between price and volume flow.


Aroon Oscillator information for GANNETT INC. The trend-following indicator can show the strengh of a current trend and likelihood that trend can continue.


Average Directional Index (ADX) information for GANNETT INC. The index can be used to identify the strengh of a trend.


Moving Average Convergence Divergence (MACD) for GANNETT INC. The indicator helps to predict trend direction and the momentum of the trend.


Stochastic Oscillator as momentum indicator for GANNETT INC. The indicator is useful for identifying overbought and oversold levels.


Relative Strength Index (RSI) for GANNETT INC. RSI is a momentum oscillator that measures the speed and change of price development. The momentum indicator was created by analyst Welles Wilder. The result compares recent gains and losses over restricted time period. Primary usage of the indicator is to identify overbought or oversold signals. When RSI indicator reaches a value of 70 it could mean that speculators should consider selling, suggests Wilder and Chong. Or vice versa when selling excess at which the RSI Indicators show a value of 30 [ Relative Strength Index for Developing Effective Trading Strategies in Constructing Optimal Portfolio ].


Heikin Ashi trading signals are generated based on the Heikin Ashi candles, which are a type of candlestick that smooths out the price action and can help to identify trends. Heikin Ashi signals can be used to identify both long and short trading opportunities.


The awesome oscillator is a momentum indicator that measures the speed and strength of price movements. It is calculated by subtracting a 34-period simple moving average (SMA) from a 5-period SMA.


The Parabolic SAR indicator is a trend-following indicator that uses a series of dots to indicate when a trend is likely to reverse. The Parabolic SAR is a lagging indicator, meaning that it does not predict reversals, but rather confirms them after they have already occurred.


Moving Average Crossover


52W High 52W Low Market Cap

Similar shares


GANNETT INC on Nasdaq

GANNETT INC on finviz

Figure below show the stock predictions.
Date Closing price Prediction was updated
2024-05-20 2.62 2024-04-19 05:06
2024-05-21 2.63 2024-04-19 05:06
2024-05-23 2.64 2024-04-19 05:06
2024-05-24 2.64 2024-04-19 05:06
2024-05-22 2.63 2024-04-19 05:06
2024-05-27 2.65 2024-04-19 05:06
2024-05-28 2.65 2024-04-19 05:06
2024-05-30 2.67 2024-04-19 05:06
2024-05-31 2.67 2024-04-19 05:06
2024-06-06 2.69 2024-04-19 05:06
2024-06-05 2.69 2024-04-19 05:06
2024-05-29 2.66 2024-04-19 05:06
2024-06-03 2.68 2024-04-19 05:06
2024-06-04 2.68 2024-04-19 05:06
2024-06-07 2.70 2024-04-19 05:06
2024-06-10 2.70 2024-04-19 05:06
2024-06-11 2.71 2024-04-19 05:06
2024-06-12 2.71 2024-04-19 05:06
2024-06-13 2.72 2024-04-19 05:06
2024-06-14 2.72 2024-04-19 05:06
2024-05-13 2.58 2024-04-19 05:06
2024-05-08 2.58 2024-04-19 05:06
2024-05-09 2.58 2024-04-19 05:06
2024-04-25 2.52 2024-04-19 05:06
2024-04-22 2.49 2024-04-19 05:06
2024-04-23 2.50 2024-04-19 05:06
2024-04-24 2.51 2024-04-19 05:06
2024-05-14 2.60 2024-04-19 05:06
2024-05-15 2.60 2024-04-19 05:06
2024-05-16 2.61 2024-04-19 05:06
2024-05-17 2.62 2024-04-19 05:06
2024-04-26 2.53 2024-04-19 05:06
2024-04-29 2.53 2024-04-19 05:06
2024-04-30 2.54 2024-04-19 05:06
2024-05-01 2.54 2024-04-19 05:06
2024-05-02 2.55 2024-04-19 05:06
2024-05-03 2.56 2024-04-19 05:06
2024-05-06 2.57 2024-04-19 05:06
2024-05-07 2.58 2024-04-19 05:06
2024-05-10 2.59 2024-04-19 05:06

The forecast (dashed curve) of the share price performance is based on historical data. Our forecast model is based on mathematical, statistical methods. The website offers price forecasts and analysis tools for equities and other securities, which are exclusively based on the prices of these securities in the past. Information about these prices is provided to us by third parties. Although we believe, If we believe that our sources are reliable, we cannot guarantee the accuracy, completeness, timeliness and correct sequencing of this information. We do not investigate the issuers of the securities to which our forecasts relate, nor do we consider any financial data or other data of such issuers with the exception of the past prices of the securities. Therefore, our forecasts do not constitute an analysis of other commercial or financial factors or circumstances, that may be relevant for future security price flows. Investments require additional considerations. Our forecasts cannot reflect the specific situation. Experience and risk profile of an individual investor or the tax implications an investment may have for the investor. Although we believe that our mathematical models are a tool to try to explore the possibility for future price development with the help of past performance, such developments are subject to a multitude of different influences. and therefore not really predictable. We cannot guarantee the success of any investment you make based on the information published here. This website is for information purposes only. All information and data on this website cannot be guaranteed to be accurate, accuracy, completeness and appropriateness - neither explicit nor implicit.