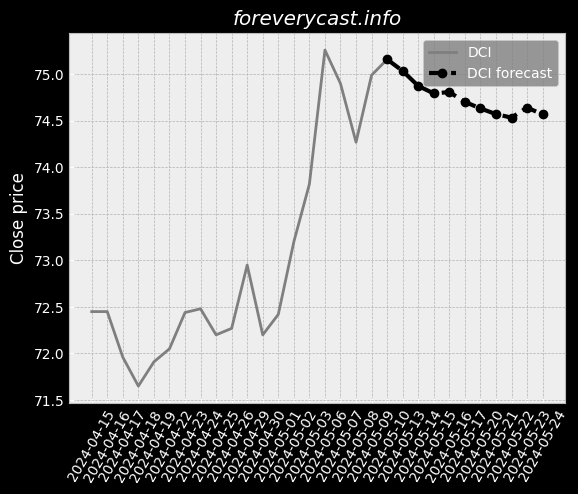
CECO ENVIRONMENTAL CORP stock forecast: down to 0.00 USD CECE stock price prognosis

STOCK

Forecast for Wed 24 Apr 2024 price

CECO ENVIRONMENTAL CORP stock price forecast for further price development down to 0.00% (time horizon: 1 day) and price target of 0.00 USD. Positive news sentiment. Short-term (time horizon: 2 weeks) CECO ENVIRONMENTAL CORP share price prediction for 2024-04-24 with daily closed price projections

Key Facts

Symbol CECE 

ISIN US1251411013 

CUSIP 125141101


Currency USD


Category Industrial & Commercial Fans & Blowers & Air Purifying Equip

Forecast price change %


News sentiment (0.61)


News <--> Close correlation for next day influence ()

Relative Strength Index (RSI)

Finance numbers

Revenue 307,417,000.0


Earnings per share 0.16


On our site we made daily predictions for finance products based on statistical analysis. You can export / download forecasted data as CSV file, no login required. The information can be used for day trading.

Summerized Form 10-K with GPT-2

8226; Global Economic Conditions. The Company's businesses are impacted by economic conditions around the globe. 8226; Worldwide Industrialization. The business experience of our management team enables us to pursue our strategy. Paul Gohr (39) has served as the Chief Accounting Officer since May 2017. 10 Item 1A. Risk Factors An investment in our securities involves a high degree of risk. Our dependence upon fixed-price contracts could adversely affect our operating results. As a result, our backlog may not be indicative of our future revenues. All of the industries in which we compete are highly competitive and highly fragmented. Certain of our products also have a much higher internally manufactured cost component. We also utilize subcontractors in North America. We will not be able to control many of these factors. This is particularly true with respect to acquisitions outside the United States.

Summerized Form 10-K with GPT-2 https://www.sec.gov/Archives/edgar/data/3197/000156459021010416/0001564590-21-010416.txt
Candlestick patterns

Candlestick patterns can be used as additional information for price prediction. Following list show which pattern applies on latest price information.

  • Meta analyst score 54.72/100
    • Good financial position.
    • Historical view, profit is growing.
    • Company revenue is growing faster compared with the industry.
    • Stock price is under book price value.

Institutional ownership list is based on filling form information

Holding name Date Amount
A - BARCLAYS PLC 2023-06-30 38587
RITHOLTZ WEALTH MANAGEMENT 2023-06-30 22049
Mesirow Financial Investment Management, Inc. 2023-06-30 16386
MetLife Investment Management, LLC 2020-09-30 4215
MetLife Investment Management, LLC 2019-12-31 14832

Fund ownership list is based on filling form information

Fund name Date Amount Profile
MORGAN STANLEY PATHWAY FUNDS 2023-11-30 1052 Long
ProShares Trust 2023-11-30 2392 Long
ProShares Trust 2023-11-30 1376 Long
ProShares Trust 2023-11-30 67 Long
BlackRock Funds 2023-11-30 62082 Long


Bollinger Bollinger Bands for CECO ENVIRONMENTAL CORP can provide the information where the market is moving based on price information.


CECO ENVIRONMENTAL CORP Short Volume Ratio is shown in the diagram. Short volume sales can be seen as an investor sentiment.


Converting prices to returns CECO ENVIRONMENTAL CORP.


On-Balance Volume information for CECO ENVIRONMENTAL CORP. On-Balance Volume information can be an indicator for bullish or bearish outcome.


Accumulation / Distribution (A/D) indicator information for CECO ENVIRONMENTAL CORP. The indicator identify divergences between price and volume flow.


Aroon Oscillator information for CECO ENVIRONMENTAL CORP. The trend-following indicator can show the strengh of a current trend and likelihood that trend can continue.


Average Directional Index (ADX) information for CECO ENVIRONMENTAL CORP. The index can be used to identify the strengh of a trend.


Moving Average Convergence Divergence (MACD) for CECO ENVIRONMENTAL CORP. The indicator helps to predict trend direction and the momentum of the trend.


Stochastic Oscillator as momentum indicator for CECO ENVIRONMENTAL CORP. The indicator is useful for identifying overbought and oversold levels.


Relative Strength Index (RSI) for CECO ENVIRONMENTAL CORP. RSI is a momentum oscillator that measures the speed and change of price development. The momentum indicator was created by analyst Welles Wilder. The result compares recent gains and losses over restricted time period. Primary usage of the indicator is to identify overbought or oversold signals. When RSI indicator reaches a value of 70 it could mean that speculators should consider selling, suggests Wilder and Chong. Or vice versa when selling excess at which the RSI Indicators show a value of 30 [ Relative Strength Index for Developing Effective Trading Strategies in Constructing Optimal Portfolio ].


Heikin Ashi trading signals are generated based on the Heikin Ashi candles, which are a type of candlestick that smooths out the price action and can help to identify trends. Heikin Ashi signals can be used to identify both long and short trading opportunities.


The awesome oscillator is a momentum indicator that measures the speed and strength of price movements. It is calculated by subtracting a 34-period simple moving average (SMA) from a 5-period SMA.


The Parabolic SAR indicator is a trend-following indicator that uses a series of dots to indicate when a trend is likely to reverse. The Parabolic SAR is a lagging indicator, meaning that it does not predict reversals, but rather confirms them after they have already occurred.


Moving Average Crossover


52W High 52W Low Market Cap

Similar shares


CECO ENVIRONMENTAL CORP on Nasdaq

CECO ENVIRONMENTAL CORP on finviz

Figure below show the stock predictions.
Date Closing price Prediction was updated

The forecast (dashed curve) of the share price performance is based on historical data. Our forecast model is based on mathematical, statistical methods. The website offers price forecasts and analysis tools for equities and other securities, which are exclusively based on the prices of these securities in the past. Information about these prices is provided to us by third parties. Although we believe, If we believe that our sources are reliable, we cannot guarantee the accuracy, completeness, timeliness and correct sequencing of this information. We do not investigate the issuers of the securities to which our forecasts relate, nor do we consider any financial data or other data of such issuers with the exception of the past prices of the securities. Therefore, our forecasts do not constitute an analysis of other commercial or financial factors or circumstances, that may be relevant for future security price flows. Investments require additional considerations. Our forecasts cannot reflect the specific situation. Experience and risk profile of an individual investor or the tax implications an investment may have for the investor. Although we believe that our mathematical models are a tool to try to explore the possibility for future price development with the help of past performance, such developments are subject to a multitude of different influences. and therefore not really predictable. We cannot guarantee the success of any investment you make based on the information published here. This website is for information purposes only. All information and data on this website cannot be guaranteed to be accurate, accuracy, completeness and appropriateness - neither explicit nor implicit.