XLRE etf prediction: down to 37.35 USD Real Estate Select Sector SPDR Fund (The) fund price price prognosis

ETF

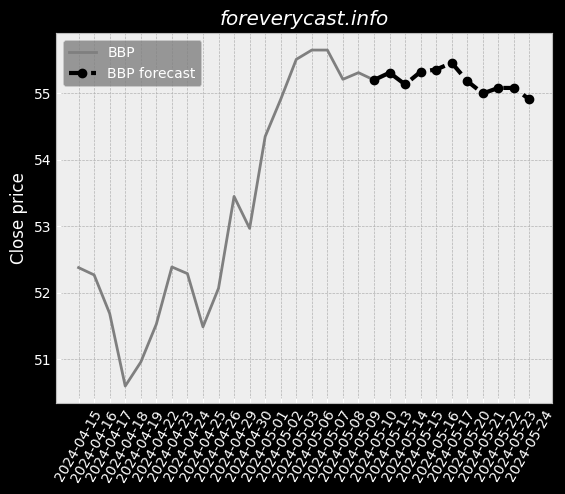
Forecast for Tue 31 Dec 2024 price 37.35

Real Estate Select Sector SPDR Fund (The) etf price forecast for further price development down to -2.51% (time horizon: 1 day) and price target of 37.35 USD. Short-term (time horizon: 2 weeks) Real Estate Select Sector SPDR Fund (The) fund price prediction for 2024-12-31 with daily closed price projections

Key Facts

Symbol XLRE 

ISIN US81369Y8600 

CUSIP 81369Y860


Currency USD

Forecast price change %

Relative Strength Index (RSI)

Finance numbers

Total Assets 5,755,535,840.01


Total Liabilities 27,044,224.82


Net Assets 5,728,491,615.19

On our site we made daily predictions for finance products based on statistical analysis. You can export / download forecasted data as CSV file, no login required. The information can be used for day trading.

Candlestick patterns

Candlestick patterns can be used as additional information for price prediction. Following list show which pattern applies on latest price information.

Institutional ownership list is based on filling form information

Fund ownership list is based on filling form information

Fund name Date Amount Profile
Northern Lights Fund Trust IV 2023-11-30 140644 Long
ALPS ETF TRUST 2023-11-30 798212 Long
Thor Financial Technologies Trust 2023-11-30 271381 Long
Strategy Shares 2023-10-31 83744 Long
Two Roads Shared Trust 2023-07-31 65433 Long

Portfolio Investments Report associated with Fund SELECT SECTOR SPDR TRUST

Symbol Cusip Name Amount Value Title Of Class Pay of profile
0 12504L109 CBRE Group Inc 1777609.0 136804788.64 CORP Long
0 03027X100 American Tower Corp 2619573.0 554982735.78 CORP Long
0 313745101 Federal Realty Investment Trust 410231.0 41449740.24 CORP Long
0 015271109 Alexandria Real Estate Equities Inc 840074.0 122373579.58 CORP Long
0 22822V101 Crown Castle Inc 2436452.0 330480349.28 CORP Long


Bollinger Bollinger Bands for Real Estate Select Sector SPDR Fund (The) can provide the information where the market is moving based on price information.


Real Estate Select Sector SPDR Fund (The) Short Volume Ratio is shown in the diagram. Short volume sales can be seen as an investor sentiment.


Converting prices to returns Real Estate Select Sector SPDR Fund (The).


On-Balance Volume information for Real Estate Select Sector SPDR Fund (The). On-Balance Volume information can be an indicator for bullish or bearish outcome.


Accumulation / Distribution (A/D) indicator information for Real Estate Select Sector SPDR Fund (The). The indicator identify divergences between price and volume flow.


Aroon Oscillator information for Real Estate Select Sector SPDR Fund (The). The trend-following indicator can show the strengh of a current trend and likelihood that trend can continue.


Average Directional Index (ADX) information for Real Estate Select Sector SPDR Fund (The). The index can be used to identify the strengh of a trend.


Moving Average Convergence Divergence (MACD) for Real Estate Select Sector SPDR Fund (The). The indicator helps to predict trend direction and the momentum of the trend.


Stochastic Oscillator as momentum indicator for Real Estate Select Sector SPDR Fund (The). The indicator is useful for identifying overbought and oversold levels.


Relative Strength Index (RSI) for Real Estate Select Sector SPDR Fund (The). RSI is a momentum oscillator that measures the speed and change of price development. The momentum indicator was created by analyst Welles Wilder. The result compares recent gains and losses over restricted time period. Primary usage of the indicator is to identify overbought or oversold signals. When RSI indicator reaches a value of 70 it could mean that speculators should consider selling, suggests Wilder and Chong. Or vice versa when selling excess at which the RSI Indicators show a value of 30 [ Relative Strength Index for Developing Effective Trading Strategies in Constructing Optimal Portfolio ].


Heikin Ashi trading signals are generated based on the Heikin Ashi candles, which are a type of candlestick that smooths out the price action and can help to identify trends. Heikin Ashi signals can be used to identify both long and short trading opportunities.


The awesome oscillator is a momentum indicator that measures the speed and strength of price movements. It is calculated by subtracting a 34-period simple moving average (SMA) from a 5-period SMA.


The Parabolic SAR indicator is a trend-following indicator that uses a series of dots to indicate when a trend is likely to reverse. The Parabolic SAR is a lagging indicator, meaning that it does not predict reversals, but rather confirms them after they have already occurred.


Moving Average Crossover


52W High 52W Low Market Cap

Similar shares

Real Estate Select Sector SPDR Fund (The) on Nasdaq

Real Estate Select Sector SPDR Fund (The) on finviz

Figure below show the etf predictions.
Date Closing price Prediction was updated
2024-12-05 37.35 2024-04-23 06:30
2024-12-02 37.35 2024-04-23 06:30
2024-12-03 37.35 2024-04-23 06:30
2024-12-06 37.35 2024-04-23 06:30
2024-05-16 36.14 2024-04-23 06:30
2024-06-06 36.96 2024-04-23 06:30
2024-06-07 37.01 2024-04-23 06:30
2024-06-18 37.32 2024-04-23 06:30
2024-07-04 37.55 2024-04-23 06:30
2024-07-05 37.56 2024-04-23 06:30
2024-11-14 37.35 2024-04-23 06:30
2024-12-04 37.35 2024-04-23 06:30
2024-12-11 37.35 2024-04-23 06:30
2024-12-13 37.35 2024-04-23 06:30
2024-12-20 37.35 2024-04-23 06:30
2024-12-09 37.35 2024-04-23 06:30
2024-12-10 37.35 2024-04-23 06:30
2024-12-23 37.35 2024-04-23 06:30
2024-12-24 37.35 2024-04-23 06:30
2024-12-12 37.35 2024-04-23 06:30
2024-12-18 37.35 2024-04-23 06:30
2024-12-16 37.35 2024-04-23 06:30
2024-12-17 37.35 2024-04-23 06:30
2024-12-19 37.35 2024-04-23 06:30
2024-12-26 37.35 2024-04-23 06:30
2024-12-30 37.35 2024-04-23 06:30
2024-12-31 37.35 2024-04-23 06:30
2024-12-27 37.35 2024-04-23 06:30
2024-12-25 37.35 2024-04-23 06:30
2024-08-06 37.46 2024-04-23 06:30
2024-08-07 37.45 2024-04-23 06:30
2024-08-08 37.44 2024-04-23 06:30
2024-08-09 37.43 2024-04-23 06:30
2024-08-12 37.42 2024-04-23 06:30
2024-08-26 37.35 2024-04-23 06:30
2024-09-10 37.31 2024-04-23 06:30
2024-09-11 37.31 2024-04-23 06:30
2024-06-19 37.34 2024-04-23 06:30
2024-06-20 37.37 2024-04-23 06:30
2024-06-21 37.40 2024-04-23 06:30
2024-06-24 37.43 2024-04-23 06:30
2024-06-25 37.46 2024-04-23 06:30
2024-06-26 37.48 2024-04-23 06:30
2024-07-01 37.52 2024-04-23 06:30
2024-10-09 37.32 2024-04-23 06:30
2024-10-10 37.32 2024-04-23 06:30
2024-10-11 37.32 2024-04-23 06:30
2024-10-22 37.33 2024-04-23 06:30
2024-10-23 37.34 2024-04-23 06:30
2024-10-24 37.34 2024-04-23 06:30
2024-10-25 37.34 2024-04-23 06:30
2024-11-20 37.35 2024-04-23 06:30
2024-11-21 37.35 2024-04-23 06:30
2024-07-08 37.57 2024-04-23 06:30
2024-08-13 37.42 2024-04-23 06:30
2024-08-14 37.41 2024-04-23 06:30
2024-08-15 37.40 2024-04-23 06:30
2024-11-27 37.35 2024-04-23 06:30
2024-04-24 36.17 2024-04-23 06:30
2024-04-25 36.31 2024-04-23 06:30
2024-04-26 36.27 2024-04-23 06:30
2024-04-29 35.97 2024-04-23 06:30
2024-04-30 35.96 2024-04-23 06:30
2024-05-01 35.95 2024-04-23 06:30
2024-05-02 35.95 2024-04-23 06:30
2024-05-03 36.07 2024-04-23 06:30
2024-05-06 36.21 2024-04-23 06:30
2024-05-07 36.12 2024-04-23 06:30
2024-05-08 36.03 2024-04-23 06:30
2024-05-09 36.02 2024-04-23 06:30
2024-05-10 35.96 2024-04-23 06:30
2024-05-13 35.94 2024-04-23 06:30
2024-05-14 35.96 2024-04-23 06:30
2024-05-15 36.01 2024-04-23 06:30
2024-05-17 36.25 2024-04-23 06:30
2024-05-20 36.31 2024-04-23 06:30
2024-05-21 36.37 2024-04-23 06:30
2024-06-13 37.22 2024-04-23 06:30
2024-06-14 37.25 2024-04-23 06:30
2024-06-17 37.29 2024-04-23 06:30
2024-06-27 37.49 2024-04-23 06:30
2024-06-28 37.51 2024-04-23 06:30
2024-07-02 37.53 2024-04-23 06:30
2024-07-03 37.54 2024-04-23 06:30
2024-10-28 37.34 2024-04-23 06:30
2024-10-29 37.34 2024-04-23 06:30
2024-11-15 37.35 2024-04-23 06:30
2024-11-18 37.35 2024-04-23 06:30
2024-11-19 37.35 2024-04-23 06:30
2024-07-09 37.57 2024-04-23 06:30
2024-08-02 37.48 2024-04-23 06:30
2024-09-06 37.32 2024-04-23 06:30
2024-09-30 37.31 2024-04-23 06:30
2024-10-01 37.31 2024-04-23 06:30
2024-10-02 37.31 2024-04-23 06:30
2024-10-03 37.32 2024-04-23 06:30
2024-10-04 37.32 2024-04-23 06:30
2024-05-23 36.45 2024-04-23 06:30
2024-05-24 36.48 2024-04-23 06:30
2024-10-14 37.33 2024-04-23 06:30
2024-10-15 37.33 2024-04-23 06:30
2024-10-16 37.33 2024-04-23 06:30
2024-10-17 37.33 2024-04-23 06:30
2024-10-18 37.33 2024-04-23 06:30
2024-10-21 37.33 2024-04-23 06:30
2024-11-13 37.35 2024-04-23 06:30
2024-11-28 37.35 2024-04-23 06:30
2024-11-29 37.35 2024-04-23 06:30
2024-05-22 36.44 2024-04-23 06:30
2024-05-27 36.54 2024-04-23 06:30
2024-05-28 36.60 2024-04-23 06:30
2024-05-29 36.68 2024-04-23 06:30
2024-05-30 36.76 2024-04-23 06:30
2024-05-31 36.81 2024-04-23 06:30
2024-06-03 36.85 2024-04-23 06:30
2024-06-04 36.88 2024-04-23 06:30
2024-06-05 36.92 2024-04-23 06:30
2024-06-10 37.06 2024-04-23 06:30
2024-06-12 37.18 2024-04-23 06:30
2024-08-16 37.39 2024-04-23 06:30
2024-08-19 37.38 2024-04-23 06:30
2024-06-11 37.12 2024-04-23 06:30
2024-08-20 37.38 2024-04-23 06:30
2024-08-21 37.37 2024-04-23 06:30
2024-08-22 37.36 2024-04-23 06:30
2024-08-23 37.36 2024-04-23 06:30
2024-08-27 37.35 2024-04-23 06:30
2024-08-28 37.34 2024-04-23 06:30
2024-08-29 37.34 2024-04-23 06:30
2024-08-30 37.33 2024-04-23 06:30
2024-09-02 37.33 2024-04-23 06:30
2024-09-03 37.33 2024-04-23 06:30
2024-09-04 37.32 2024-04-23 06:30
2024-09-05 37.32 2024-04-23 06:30
2024-09-09 37.31 2024-04-23 06:30
2024-09-12 37.31 2024-04-23 06:30
2024-09-13 37.31 2024-04-23 06:30
2024-09-16 37.31 2024-04-23 06:30
2024-09-17 37.31 2024-04-23 06:30
2024-09-18 37.31 2024-04-23 06:30
2024-09-19 37.31 2024-04-23 06:30
2024-09-20 37.31 2024-04-23 06:30
2024-09-23 37.31 2024-04-23 06:30
2024-11-22 37.35 2024-04-23 06:30
2024-07-10 37.57 2024-04-23 06:30
2024-07-11 37.57 2024-04-23 06:30
2024-07-12 37.57 2024-04-23 06:30
2024-07-15 37.57 2024-04-23 06:30
2024-07-16 37.57 2024-04-23 06:30
2024-07-17 37.56 2024-04-23 06:30
2024-07-18 37.56 2024-04-23 06:30
2024-07-19 37.56 2024-04-23 06:30
2024-07-22 37.55 2024-04-23 06:30
2024-07-23 37.54 2024-04-23 06:30
2024-07-24 37.54 2024-04-23 06:30
2024-07-25 37.53 2024-04-23 06:30
2024-07-26 37.52 2024-04-23 06:30
2024-07-29 37.51 2024-04-23 06:30
2024-07-30 37.50 2024-04-23 06:30
2024-07-31 37.50 2024-04-23 06:30
2024-08-01 37.49 2024-04-23 06:30
2024-08-05 37.47 2024-04-23 06:30
2024-10-30 37.34 2024-04-23 06:30
2024-10-31 37.34 2024-04-23 06:30
2024-11-01 37.34 2024-04-23 06:30
2024-11-04 37.34 2024-04-23 06:30
2024-11-05 37.34 2024-04-23 06:30
2024-11-06 37.35 2024-04-23 06:30
2024-11-07 37.35 2024-04-23 06:30
2024-11-08 37.35 2024-04-23 06:30
2024-11-11 37.35 2024-04-23 06:30
2024-11-12 37.35 2024-04-23 06:30
2024-09-24 37.31 2024-04-23 06:30
2024-09-25 37.31 2024-04-23 06:30
2024-09-26 37.31 2024-04-23 06:30
2024-09-27 37.31 2024-04-23 06:30
2024-10-07 37.32 2024-04-23 06:30
2024-10-08 37.32 2024-04-23 06:30
2024-11-25 37.35 2024-04-23 06:30
2024-11-26 37.35 2024-04-23 06:30

The forecast (dashed curve) of the share price performance is based on historical data. Our forecast model is based on mathematical, statistical methods. The website offers price forecasts and analysis tools for equities and other securities, which are exclusively based on the prices of these securities in the past. Information about these prices is provided to us by third parties. Although we believe, If we believe that our sources are reliable, we cannot guarantee the accuracy, completeness, timeliness and correct sequencing of this information. We do not investigate the issuers of the securities to which our forecasts relate, nor do we consider any financial data or other data of such issuers with the exception of the past prices of the securities. Therefore, our forecasts do not constitute an analysis of other commercial or financial factors or circumstances, that may be relevant for future security price flows. Investments require additional considerations. Our forecasts cannot reflect the specific situation. Experience and risk profile of an individual investor or the tax implications an investment may have for the investor. Although we believe that our mathematical models are a tool to try to explore the possibility for future price development with the help of past performance, such developments are subject to a multitude of different influences. and therefore not really predictable. We cannot guarantee the success of any investment you make based on the information published here. This website is for information purposes only. All information and data on this website cannot be guaranteed to be accurate, accuracy, completeness and appropriateness - neither explicit nor implicit.